
The Vanguard US Small Cap ETF is breaking out to the upside led by the recovery in growth stocks, which have shown signs of life following weakness in 2022.While the near-term technical picture for the VB suggests some further near-term upside, the ETF is unlikely to generate strong long-term returns. Future returns are likely to be lower than seen in the past even if profit margins remain at all-time highs as real sales growth slows in line with real GDP.
VB: Small Caps Breaking Out Is A Trade Not An Investment
The Vanguard US Small Cap ETF (NYSEARCA:VB) has performed well since the start of the year due to the strong recovery seen in small cap growth stocks. The VB looks to have broken out to the upside, and the path of least resistance is higher for now. However, from a long-term perspective, real return prospects are poor, with the VB likely to return little more than zero in real terms over the next decade.
The VB ETF
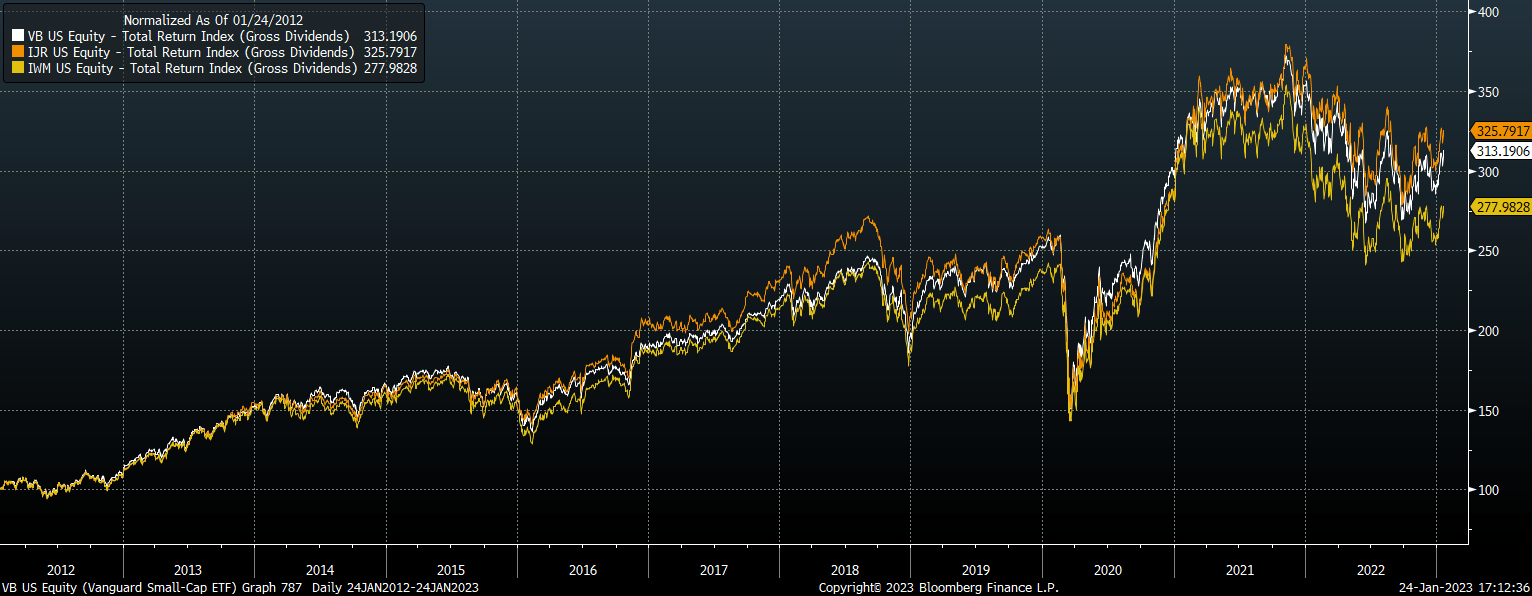
The VB tracks the CRSP US Small Cap Index. The market-cap-weighted index includes the bottom 2-15% of the investable universe. No single stock in the index has more than a 0.39% weighting, and the industry split is skewed towards industrials, which have a 21% weighting, followed by financials at 15% and consumer discretionary at 14%. The fund boasts a market cap of USD46bn as its assets have surged in recent years, and it is slowly catching up with the iShares Russell 2000 ETF (IWM). While the Vanguard website shows a trailing PE ratio of just 12.3x, this excludes loss making companies. When they are included, this figure rises to 21.6x. The ETF pays a dividend yield of 1.4% and charges an expense fee of just 0.05%. The VB has outperformed the IWM consistently over recent years which is due to the higher focus on quality in the underlying index.
Breaking Out Thanks To Growth Recovery
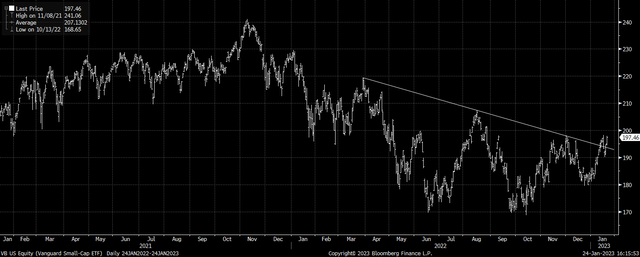
I noted in an article on the IWM earlier this month that the index looked poised for a bullish breakout. In the case of the VB, this breakout has already been achieved. While the weakness following the CPI release threatened to restore the downtrend, strength over recent days looks to have confirmed the break of down trendline resistance, and the path of least resistance for now is up.
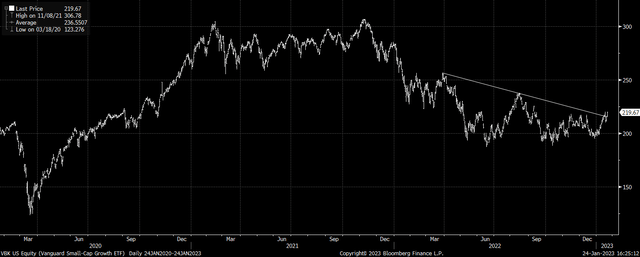
After leading the declines over the past years, it is the growth segment of the market that has been driving the recovery in the VB. The Vanguard Small Cap Growth ETF (VBK) appears to also be breaking out to the upside.
Valuations Are Far From Cheap
While the near-term technical picture for the VB suggests some further near-term upside, the ETF is unlikely to generate strong long-term returns. In fact, after the recent rally I estimate that the index is priced for little more than zero real returns over the next decade.
While valuations have come down from their lofty 2021 peak, thanks to lower prices and rising earnings, the CRSP US Small Cap Index still trades with a PE ratio of 21.6x. This falls to 17.7x on a forward basis as analysts are anticipating 22% earnings growth in 2023, but this seems highly optimistic in this economy, and analysts have a track record of overestimating forward earnings.
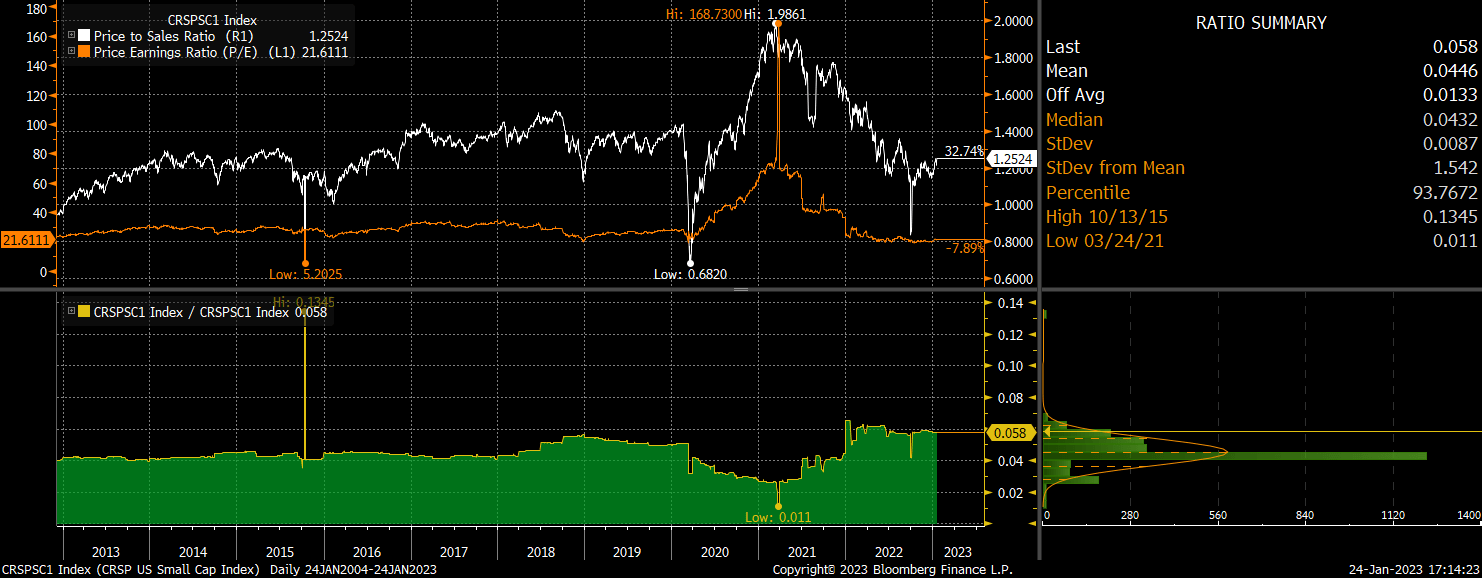
If analysts are right, this would put the average profit margin on the CRSP US Small Cap Index up at 7.0%, compared with a long-term average of 4.5%. Even if profit margins do rise to record highs and stay there indefinitely, future profit growth will be constrained by sales growth, which has averaged just under 4% in real terms over the past decade. With a dividend yield of 1.6%, this means that if we extrapolate out the rate of real sales growth into the future, we arrive at expected annual returns of around 4.5%, assuming no change in valuations or the dividend payout ratio.
However, real sales growth should be expected to slow in line with the US economy. After averaging over 2% growth over the past decade, this is likely to fall to below 1% over the next decade as growth in the working-age population slows and the long-term downtrend in productivity continues. 1% slower sales growth going forward would move real returns on the VB down to around 3.5%.
The main risk comes from a decline in profit margins, which fluctuate greatly in line with the economic cycle. Even a 2 percentage point decline in profit margins over the next decade, which would still leave them above their long-term average, would be enough to reduce annual real returns by almost 3% per year, to little more than zero. When we consider that the 10-year US inflation-linked bond offers a real return of 1.2% per year with must less volatility, the investment case for the VB is weak.
Summary
The VB looks to be breaking out to the upside, led by the recovery in the growth segment, which has shown new signs of life following intense weakness in 2022. While valuations remain far below their 2021 peak levels, PE ratios remain elevated even with companies posting record profit margins. With real sales growth set to slow over the coming years in line with real GDP growth, future returns are likely to be lower than seen in the past, even if profit margins remain at record levels. A gradual mean reversion lower in profit margins would likely see real returns come in little higher than zero over the next decade in my view, underperforming Treasuries with much higher volatility.
Enjoyed this article? Sign up for our newsletter to receive regular insights and stay connected.