During times of elevated probability for distress, stability and income predictability are becoming increasingly important factors within typical investor portfolios. While these “flight-to-safety” dynamics warrant the necessary de-risking of portfolio, they tend to inflict damage on the yield and its prospects of growth.
To offset the consequences on the yield, dividend aristocrats come in handy. Commonly, a dividend aristocrat is referring to a stock, which is included in the S&P 500 and has paid, as well as increased, the dividend payable for at least 25 years in a row.
The ProShares S&P 500 Dividend Aristocrats ETF (NOBL) is one of the most recognized ETFs tracking the universe of dividend aristocrats. However, looking at the offered dividend yield, it can quickly be noticed that it is not that attractive at all (~2.1%). It offers only 60 basis points of positive spread from the S&P 500. Compared to the U.S. T-bill, the spread becomes negative at 340 basis points.
By investing directly in the NOBL or any other ETF tracking the overall spectrum of dividend aristocrats, investors automatically sacrifice the level of yield and are forced to suffer a tangible opportunity cost associated with thinner streams of current income.
So, the question is whether there is an option to have an exposure to companies that pay regular, growing and at the same time attractive enough dividends.
The answer is REIT aristocrats
Within the dividend aristocrat space, which consists of ~67 companies, there are three, which are classified as equity REITs:
In my opinion, having an exposure towards a combination of O, ESS and FRT is the right recipe for stable, growing and more attractive yields than compared to a plain-vanilla approach to dividend aristocrats.
Here are the key reasons supporting my thesis.
#1 Juicy yields
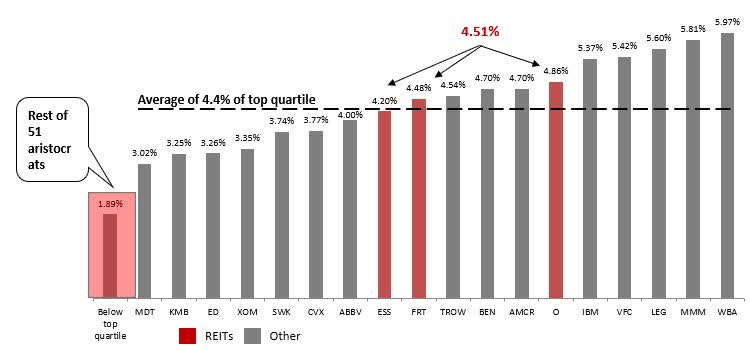
As stated above, the average yield one can get from a pure-play exposure to dividend aristocrats stands at ~2.1%. This is clearly not acceptable for the vast majority of dividend income seeking investors.

IEX cloud, author's calculations
REITs, on the other hand, provide an average yield of 4.5%, which is already something more attractive and material. In fact, this is by 10 basis points above the average of top quartile of dividend aristocrats and considerably higher than the average of remaining aristocrats (51 constituents), which yield only 1.89%.
#2 Healthy payout ratios
Determining the payout ratios for REITs and comparing them to other corporates is a tricky exercise. This is because REITs tend to record rather aggressive dividend payout ratios, which oftentimes exceed 100% from the net income level. A more appropriate way how to assess the payout ratios of REITs is through a funds from operation (FFO) measure, where most of the non-cash items (e.g., property depreciation expense) are adjusted for and included back in the FFO.
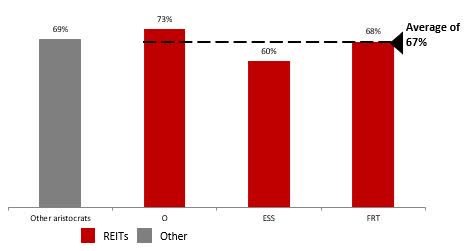
The graph below depicts FFO payout ratios for O, ESS and FRT and net income payout ratios for the remaining aristocrats, where both top and bottom 15% (or extremes) are excluded.

IEX cloud, author's calculation
- Tobias, Andrew (Author)
- English (Publication Language)
- 320 Pages - 04/19/2022 (Publication Date) - Harper...
- Reference Guide, Investment Lawyer's (Author)
- English (Publication Language)
- 46 Pages - 07/12/2019 (Publication Date) -...
We can see that average FFO payout ratio for equity REITs is even 200 basis points lower than for the other dividend aristocrats. The key takeaways from this are that:
- the higher yield provided by the REITs is not at the expense of more aggressive payout ratio
- the payout ratio of ~67% is considered relatively conservative introducing a buffer in case of negative volatility on the cash flow side and an ample room for ensuing dividends
#3 Fortress balance sheets
Now, once we have established that the prevailing dividends are attractive and the yields are underpinned by robust FFO payout ratios, it is critical to understand the underlying basis of capital structure. Very often it is the case that higher yields stem from excessive leverage and overly debt saturated balance sheets. In such situations, even a tiny rate of change in the cost of financing level or temporarily struggles on the cash flow front can get significantly amplified by the massive leverage. This can in turn result not only in dividend cuts, but also a permanent impairment of capital via, for instance, new share issuances.
Here are the critical facts that allow us to make justified conclusions pertaining to the credit risk of these REITs:

NAREIT, author's calculation
The capital structures of FRT, O and ESS are solid both from the leverage and debt coverage perspectives. Compared to the relevant sector benchmarks levels, all three REITs carry less credit risk on their balance sheets. On absolute terms, debt/EBITDA below 6x for REITs is deemed healthy. The same takeaway applies for debt ratio. Moreover, all three companies are rated at an investment grade level, which is not that common among other U.S. equity REITs.
The bottom line
Investing in dividend aristocrats is a strategy, which inherently comes with a great degree of stability and at the same time is supposed to generate a reasonable level of current income. However, the latter component offered by most of the aristocrats is far below the risk free rate and is negative if expressed in real terms.
To capture the “stability” factor and replace the low-yielding aspect with something that is more attractive and acceptable for dividend-seeking investors, three equity REITs (O, FRM and ESS) provide a solution.
The average yield of these REITs is at 4.5% supported with a healthy FFO payout ratio (~67%). Looking at the leverage, all three companies are financially resilient due to IG-ratings and all debt and coverage ratios being below the benchmark averages.
In a nutshell, a more pronounced portfolio skew towards O, FRM and ESS should be considered by investors, who wish to enjoy predictable, regular and at the same time relatively juicy streams of current income.


