
The Treasury yield curve has moved lower as softening inflation data prompts bond investors to rethink their allocations. Stocks, led by small caps, surged last week for a 3rd straight weekly advance. SHY ETF offers a modest annual expense ratio and liquidity, but the yield is expected to fall as rate cut chances increase.
Is good news now good news? And is bad news now bad news? I think we might be there. Consider what transpired last week – cool CPI data paired with, at long last, a tame Retail Sales print. Wholesale prices were also much softer than expected, as seen through October PPI figures. Not surprisingly, the interest rate landscape has shifted dramatically from just a month ago.
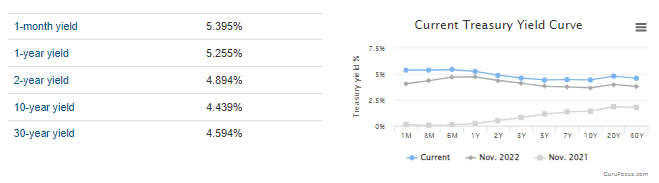
Recall in mid-October how fears of debt refunding fueled much higher long-term interest rates – north of 5% on the 30-year. The benchmark 10-year rate soared to 5%. Today, the entire curve has been pressed lower. For the first time in this cycle, in fact, the yield on money market mutual funds is above that of near-term bills.
Treasury Yield Curve Falls
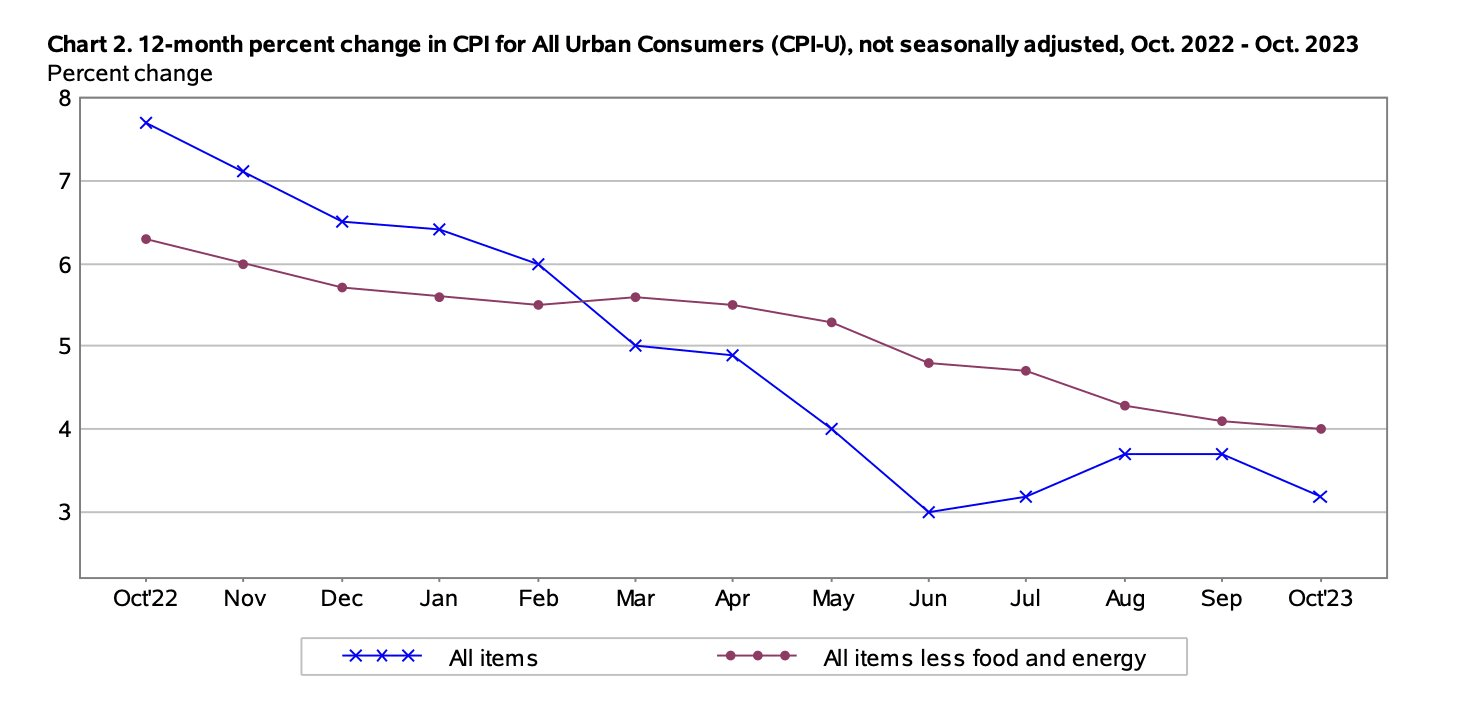
Headline & Core CPI Trending Lower
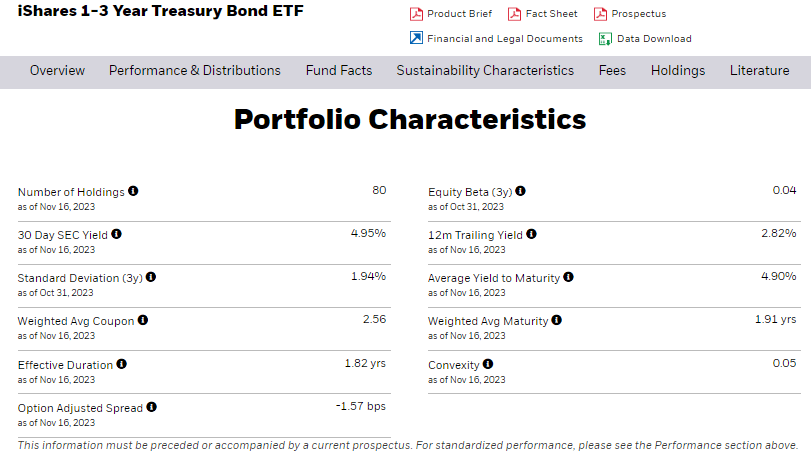
I maintain a hold rating on the iShares 1-3 Year Treasury Bond ETF (NASDAQ:SHY). Stepping out a bit on the duration front is perhaps wise while keeping cash in a 5.4% money market fund should work for the next few months.
For background, SHY features a modest annual expense ratio of just 15 basis points and liquidity is robust with the fund that tracks the 1-3 year slice of the Treasury curve. Average daily volume is high at more than 3.3 million shares and the 30-day median bid/ask spread is just a single basis point. The fund’s current yield to maturity, the key yield measure investors should look to with a product like this, is back under 5% (4.9% as of November 16, 2023) after being above that psychologically important level for months.
SHY: Latest Yield Now < 5%
Bringing its yield down is the reality that the Fed is done raising rates. The holiday week’s data deck is light, but we will get a bevy of critical economic reports during the final week of November and on the first trading session of December. If we see a continued weakening in the labor market, the Fed may feel the heat to not just hold at the upcoming FOMC meeting, but possibly reduce its target policy rate early next year. Annualized CPI ex-lagged housing indicators appear healthy, and any job losses, should they occur, would warrant the need to dis-invert the Treasury rate curve.
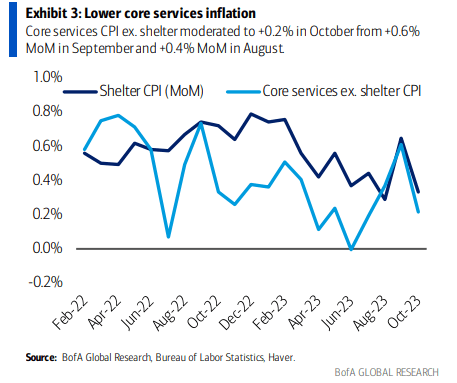
Easing Core Services ex-Shelter CPI
Meanwhile, corporations are wrapping up what’s been a stellar earnings period. The Q3 reporting season has verified much stronger than what strategists were expecting. An 82% EPS beat rate is the best in about two years and top-line figures were decent. It wasn’t all rosy, however. The collective fourth-quarter guidance ratio was fully two-to-one negative. The result was a full-year 2023 EPS forecast being nearly unchanged around $220 with $247 of S&P 500 per-share earnings expected next year.
S&P 500 Earnings Season Wrapping Up
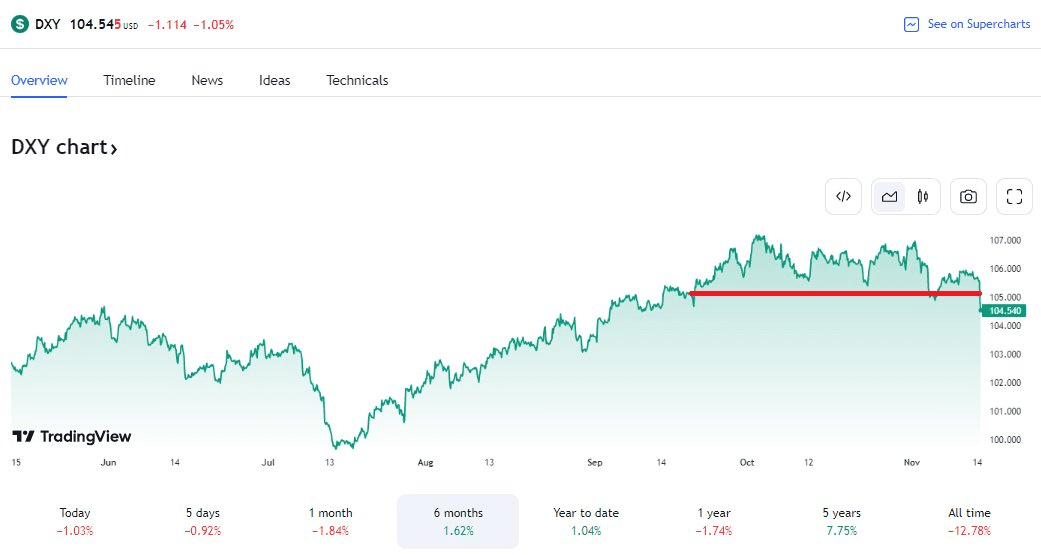
What else am I watching as we head into year-end? Keep your eyes on movements in the US Dollar Index. It broke below the pivotal 105 level earlier this month – a further pullback could set the stage for the SPX inching closer to all-time highs.
It’s not all about large caps, though. Small caps usually do best following the end of a Fed tightening cycle, and while quantitative tightening is ongoing, a lower policy rate looking ahead 12 months could be particularly helpful for beaten-down names in the S&P SmallCap 600 Index and the Russell 2000 Index.
US Dollar Index Breaks Support
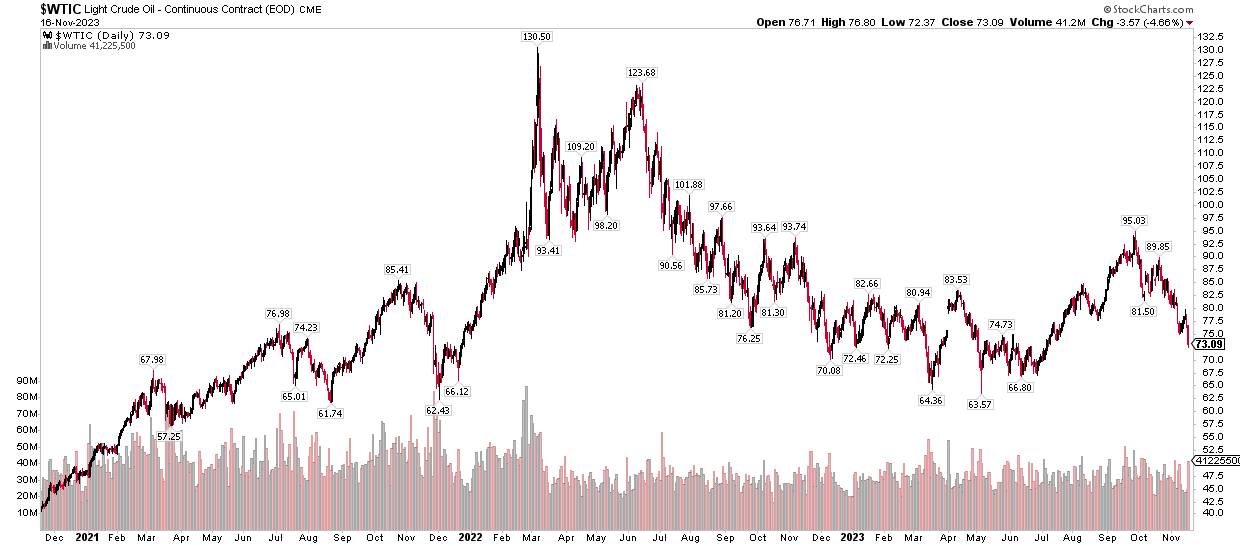
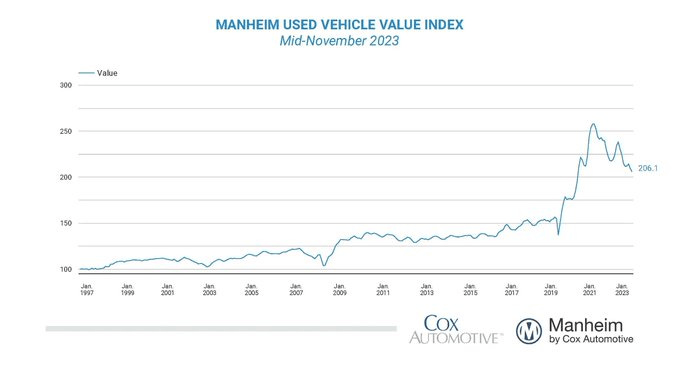
On the commodities front, there are further signs of disinflation. Along with Walmart (WMT) mentioning deflation in its Q3 profit report, WTI’s sharp decline from $95 to, at times last week, under $75 is a clear warning sign that the growth situation could turn less sanguine. Headline CPI will almost certainly be pressured lower given the retreat in WTI and retail gasoline prices. Used car and truck price tags also fell in the latest reading of the Manheim Used Vehicle Value Index.
WTI Drops 20% from its September Peak
Used Vehicle Prices Fall Further
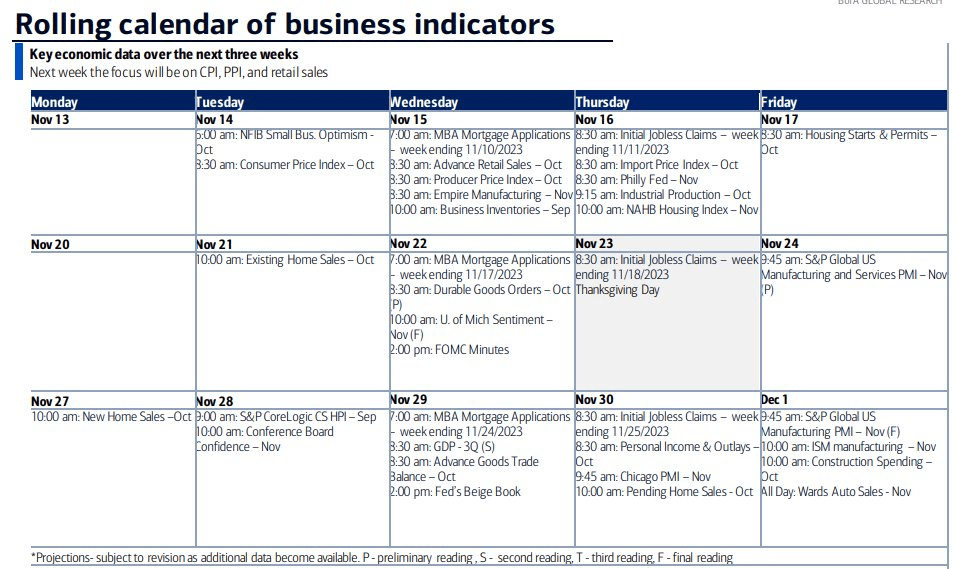
Looking ahead, we’ll get key reports in the coming days, including Existing Home Sales, Durable Goods, FOMC Minutes, Jobless Claims before the turkey comes out, and US PMIs on Friday.
Key Economic Data
On the earnings front, NVIDIA (NVDA) is the headliner on Tuesday AMC, but don’t discount the impact from other key companies including Zoom (ZM) on Monday afternoon. Tuesday’s pre-market is stacked with reports across sectors, but with a focus on the consumer: Kohl’s (KSS) Medtronic (MDT), Lowe’s (LOW), Best Buy (BBY), Baidu (BIDU), Abercrombie & Fitch (ANF), DICK’S Sporting Goods (DKS), American Eagle Outfitters (AEO) and Analog Devices (ADI) all issue results.
Nordstrom (JWN), Urban Outfitters (URBN), and Guess? (GES) round out retail earnings. A read on the global industrial picture comes via Deere & Company (DE) on Wednesday before the bell.
Earnings on Tap

The Bottom Line
I have a hold rating on SHY. It’s a decent place to put cash right now, but as rate cut chances increase, expect its yield to fall and reinvestment rate risk to rise.
Enjoyed this article? Sign up for our newsletter to receive regular insights and stay connected.