
I don’t know about you, but I’m getting tired of all this winning.
No, really.
I’m getting a little concerned about just how well dividend stocks have performed this year.
Here’s my thesis, in brief:
The market is freaking out about potential disruptions to various industries, especially software, and panic-selling out of anything that looks remotely disruptable by AI. A lot of these funds flowing out of AI-vulnerable industries are flowing into “old economy” stocks like consumer staples and energy that are deemed AI-resistant.
Moreover, the market has simultaneously become concerned about the gargantuan level of capital expenditures being committed by Big Tech to build out AI infrastructure. It’s an awful lot to spend without having a really good idea about what the ROI will be. Some of the funds flowing out of Big Tech are also flowing into AI-resistant stocks.
This flight from AI-vulnerable and AI big-spenders into AI-resistant sectors and industries sounds reasonable. But as with so many significant swings in the market, I think it is overdone.
Forgive my Texas dialect, but… y’all, it’s gone too far.
The market has gotten too greedy for certain undisruptable dividend stocks, and we dividend investors should be fearful in the face of this reflexive swing in our favor.
I know I sound like an ungrateful little worrywart.
But as investors, isn’t it our job to worry (at least a little bit) when things seem too good to be true?
Here’s the agenda this week:
- Some charts illustrating dividend stocks’ continued revenge tour as well as the accelerating risk-off environment over the last few months.
- Some hard data that, in my view, shows where the flight-to-safety-from-the-big-bad-AI has gone way too far.
- Two more sectors that are not particularly known for dividends that have also become quite extended recently.
- How I’m allocating capital in this environment.
Onward.
Dividend Stocks’ Revenge Tour Continues
The theme of the market has totally shifted from the “buy anything and everything AI-related” environment of 2024-2025 to a new environment of “get me the heck out of AI and anything vulnerable to AI” in 2026.
AI is starting to look like the Model T, and lots of stocks and industries are starting to look like horse-drawn buggies.
The speed of this sentiment shift has been absolutely wild.
And it has been phenomenally beneficial for moderate-yielding dividend stocks that almost entirely exist outside of the AI ecosystem.
Just look at the total returns since November 2025 of popular dividend ETFs from First Trust (FDL), Schwab (SCHD), iShares (HDV) and more iShares (DVY), and VictoryShares (CDL) compared to AI-related stocks (CHAT) and especially software companies (IGV):
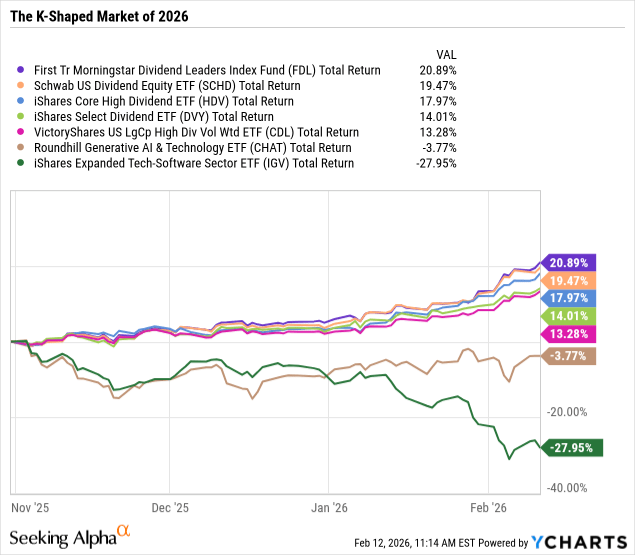
Now that’s a K-shape!
Given the relative difference in market cap between defensive, dividend-paying sectors like staples, energy, pharma, and utilities, even a small percentage of funds diverted into them from megacap tech stocks makes a big difference.
At the same time, in the years leading up to November 2025, the outperformance of the cap-weighted S&P 500 (SPY) over the equal-weighted S&P 500 (RSP) showed a very similar pattern to the inflating tech bubble of the late-1990s:
Wall Street Journal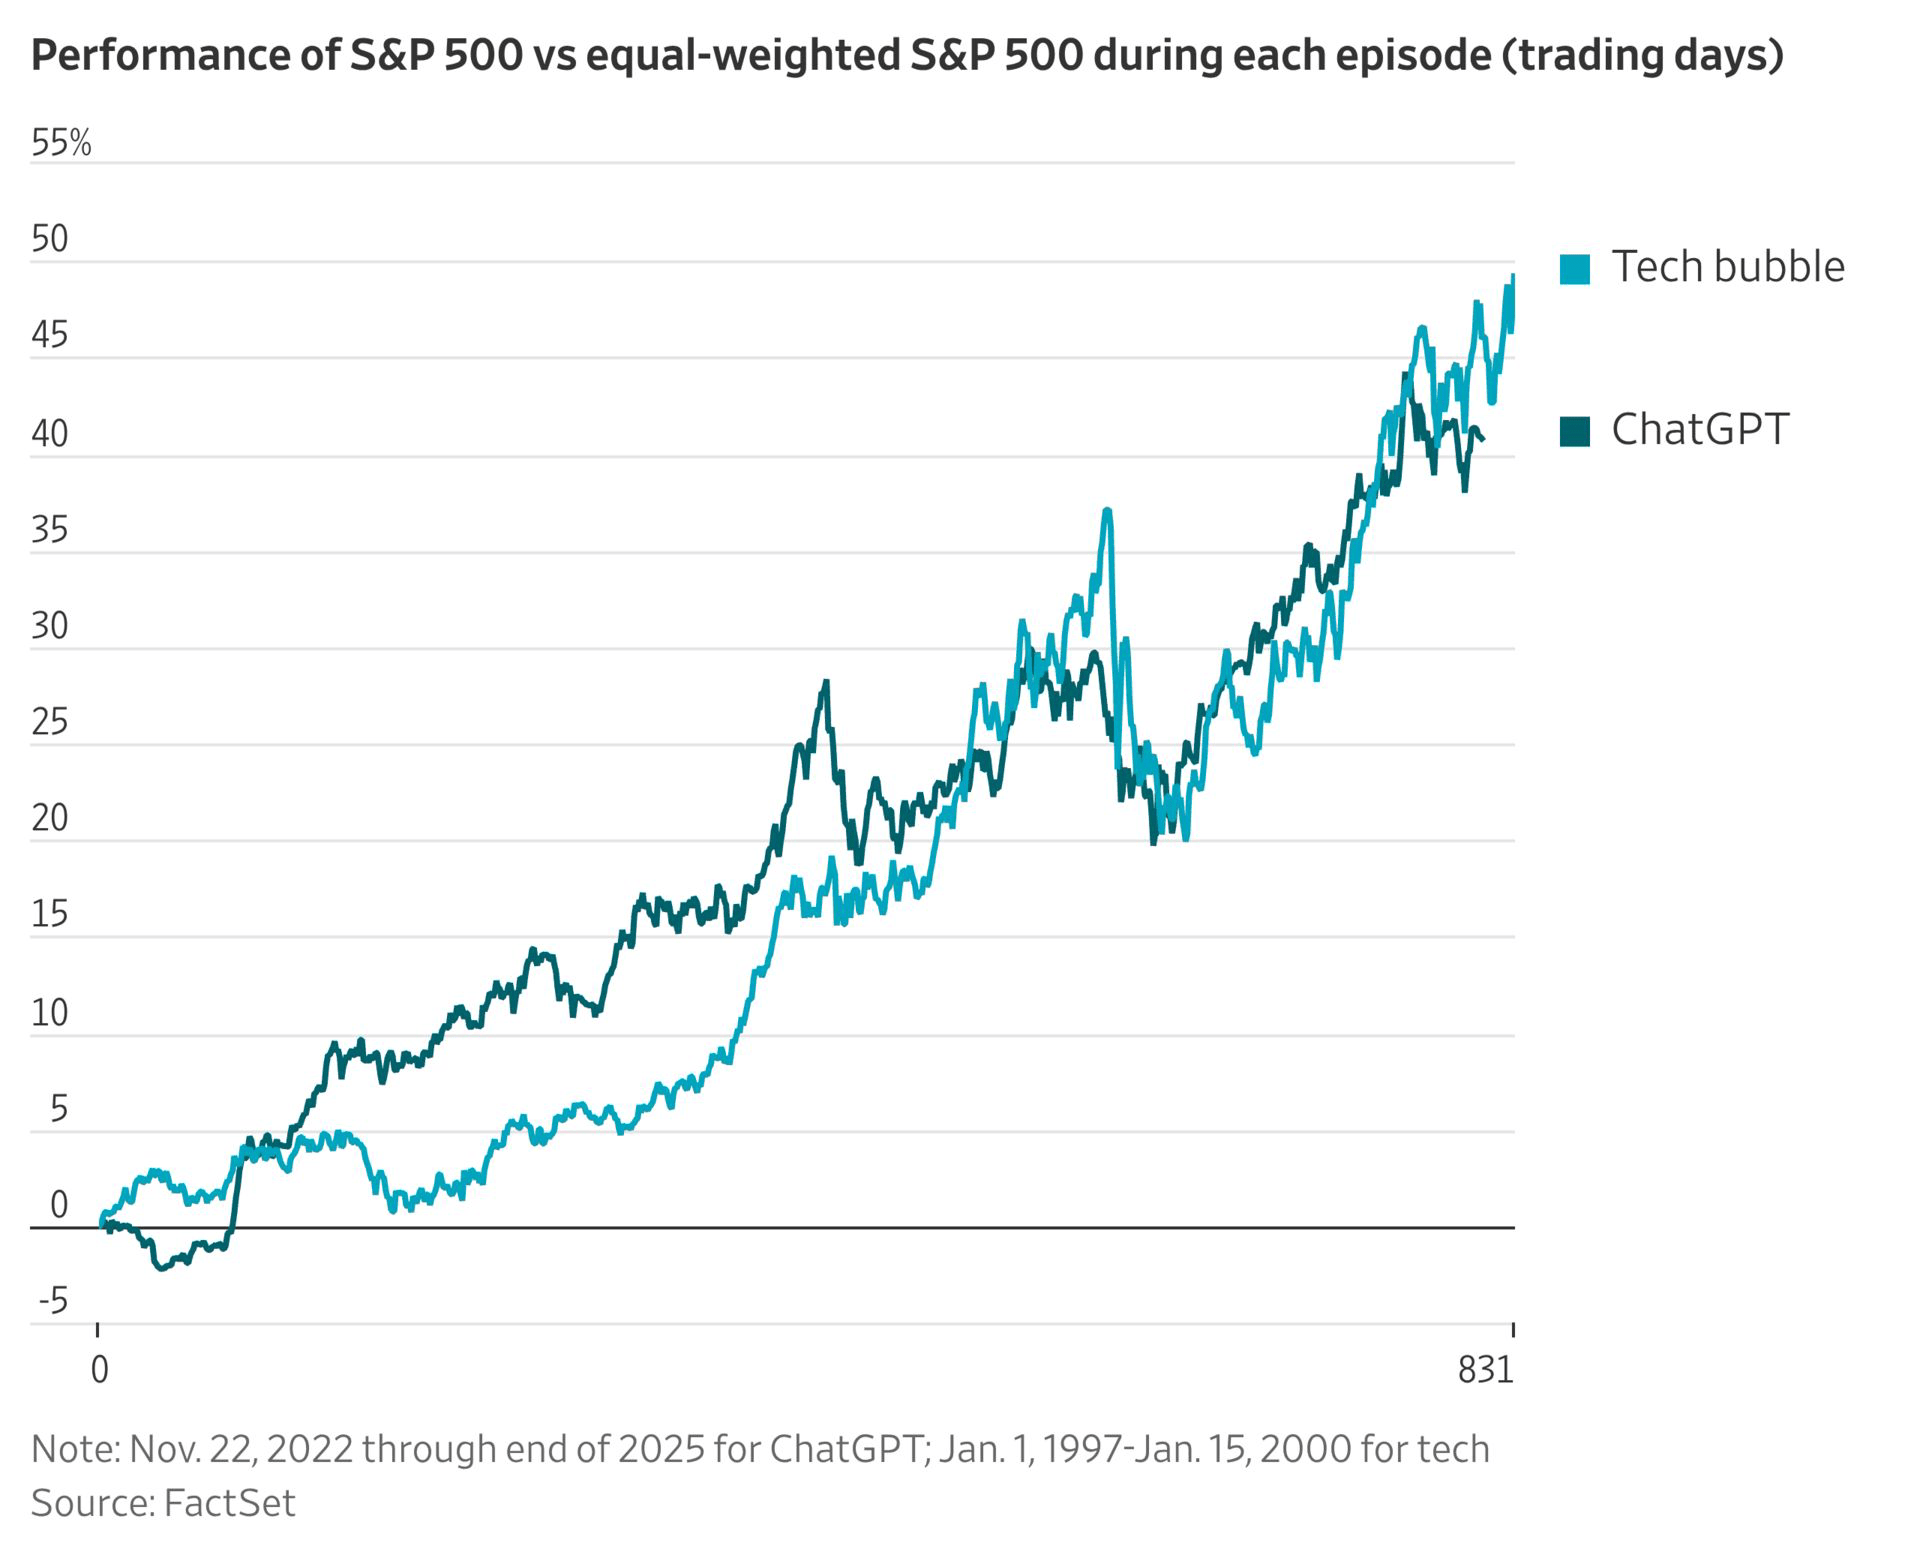
The chart above shows the degree of outperformance, in percentage points, of the SPY over the RSP over two separate, 831-trading-day periods of time.
While I didn’t have a cool chart like this, I wrote about this phenomenon multiple times last year. While it seems obvious that the cap-weighted index would outperform because of a handful of big winners, that is actually a somewhat rare experience in the market.
And it may be over.
Since November 2025, the equal-weight has been regaining lost ground on the cap-weight:
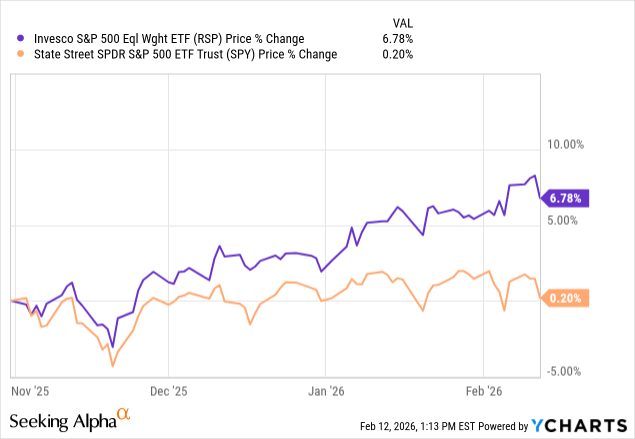
On the surface, this performance gap may not look that dramatic.
But under the surface, there has been a huge shift from higher-risk stocks to lower-risk stocks.
Here are three of my favorite “risk-on” indicators: The Nasdaq Index (QQQ), Cathie Wood’s ARK Innovation ETF (ARKK), and Bitcoin (IBIT):
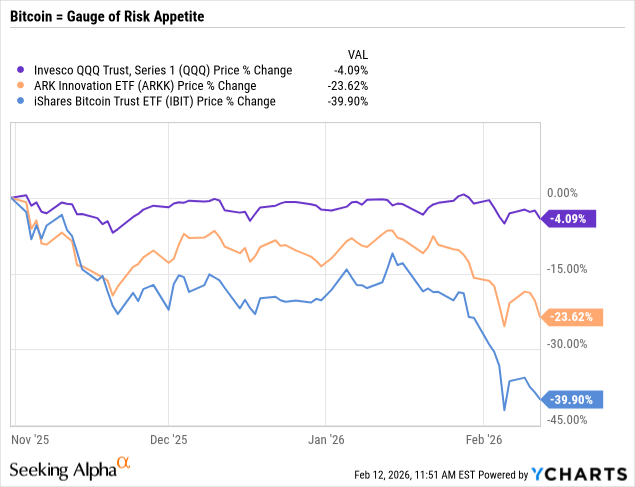
I think this, once again, goes to show that Bitcoin is not a hedge of any kind. It is purely a measurement of investor risk appetite.
I’m glad to have avoided this carnage as I have never and will never own Bitcoin, but I don’t take pleasure in its downturn. I have a few friends who have lost a significant amount of money on their inadvisably large crypto positions.
While I don’t have a stance on what crypto investors should do right now, this is perhaps a good time to reiterate my argument that no investor needs to own Bitcoin or any other crypto asset.
- Like gold, silver, art, vintage wines, and 1969 Camaros, crypto assets have no cash flow and never will. Therefore, they are priced purely on investor sentiment, the future of which cannot be predicted.
- Unlike all of the above, there is little to no practical, non-speculative use (with the notable exception of criminal activity) and therefore little to no intrinsic value for crypto assets.
- There is no true scarcity in the crypto space. Bitcoin advocates argue that the limit on the number of Bitcoins that will ever exist creates scarcity, but an effectively infinite amount of other crypto assets can be created that act the same as Bitcoin.
- The sheer number of scammers and grifters who swim in the crypto waters should make investors suspect of the whole space.
Perhaps some speculators are now sobering up from their easy-profits-induced high over the last few years and reallocating capital into the “real economy” — that exceedingly mundane world of tangible goods and services.
It’s Gone Too Far
Let’s hone in on that exceedingly mundane world and get back to the central thesis from the introduction: The rapid shift from the glitz and glamor of AI to tried-and-true dividend payers that can’t be replaced with Claude Code.
I get it. This is exactly what I thought would happen. Only, it has happened a lot faster and more intensely than I thought it would.
The pendulum has swung too far.
Let me show you what I mean.
Here’s a helpful chart from the smart fellows at Ritholtz Wealth Management comparing the forward P/E ratios of the technology sector (XLK) and the consumer staples sector (XLP).
The Compound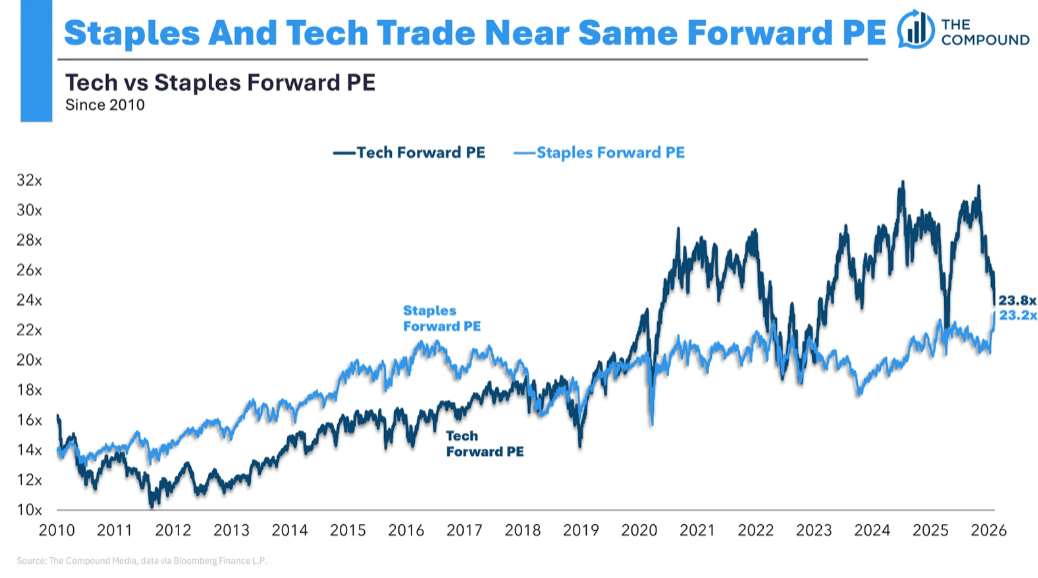
Technology and staples now trade at almost the same valuation! Both are over 23x forward P/E ratios.
This makes absolutely no sense.
Here’s another chart from Yardeni Research showing that staples (!!!) now trade at a higher forward P/E multiple than the S&P 500 (!!!).
Yardeni Research
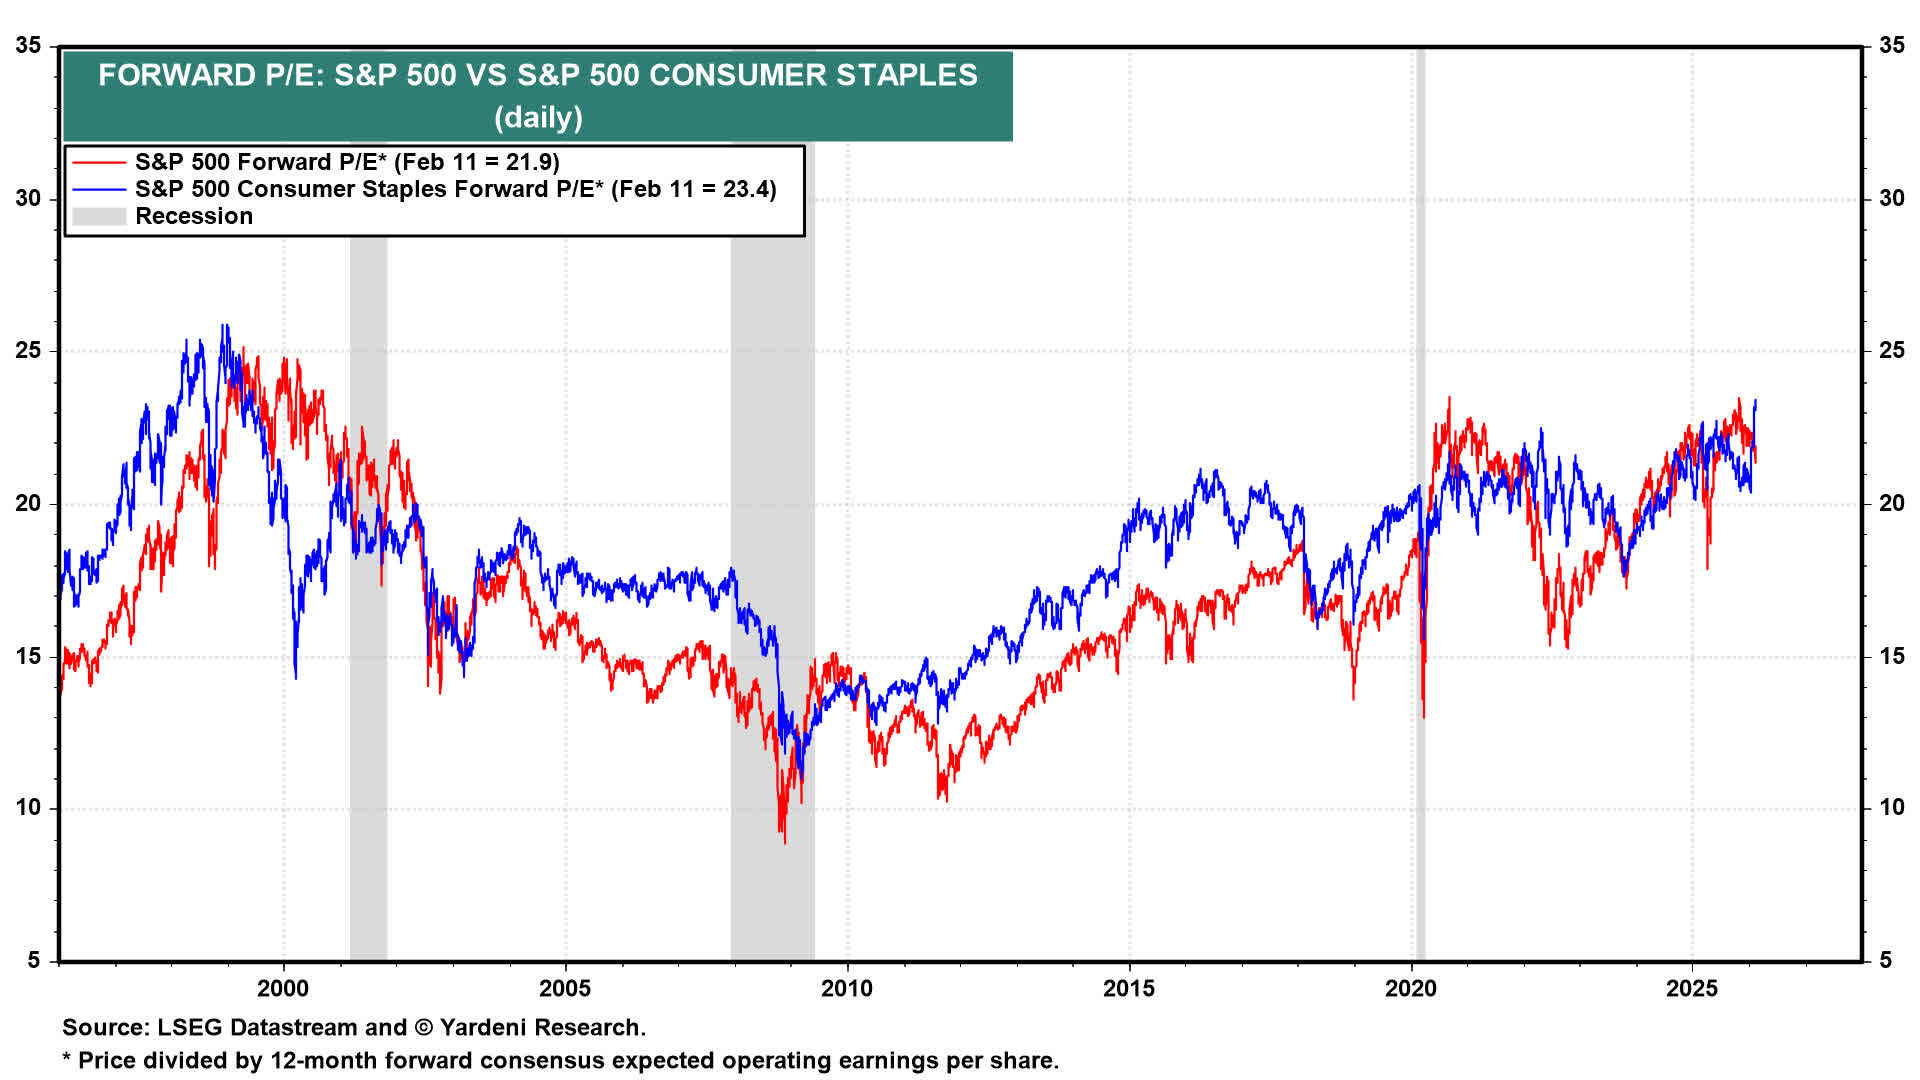
Okay, as you can see from the chart, it isn’t necessarily unusual, historically speaking, for staples to trade at a higher valuation than the market. Whether staples are valued higher or lower than the market can be an indication of overall investor risk appetite.
But in today’s world of low population growth and low job growth, the earnings growth prospects of staples companies are far, far lower than they used to be.
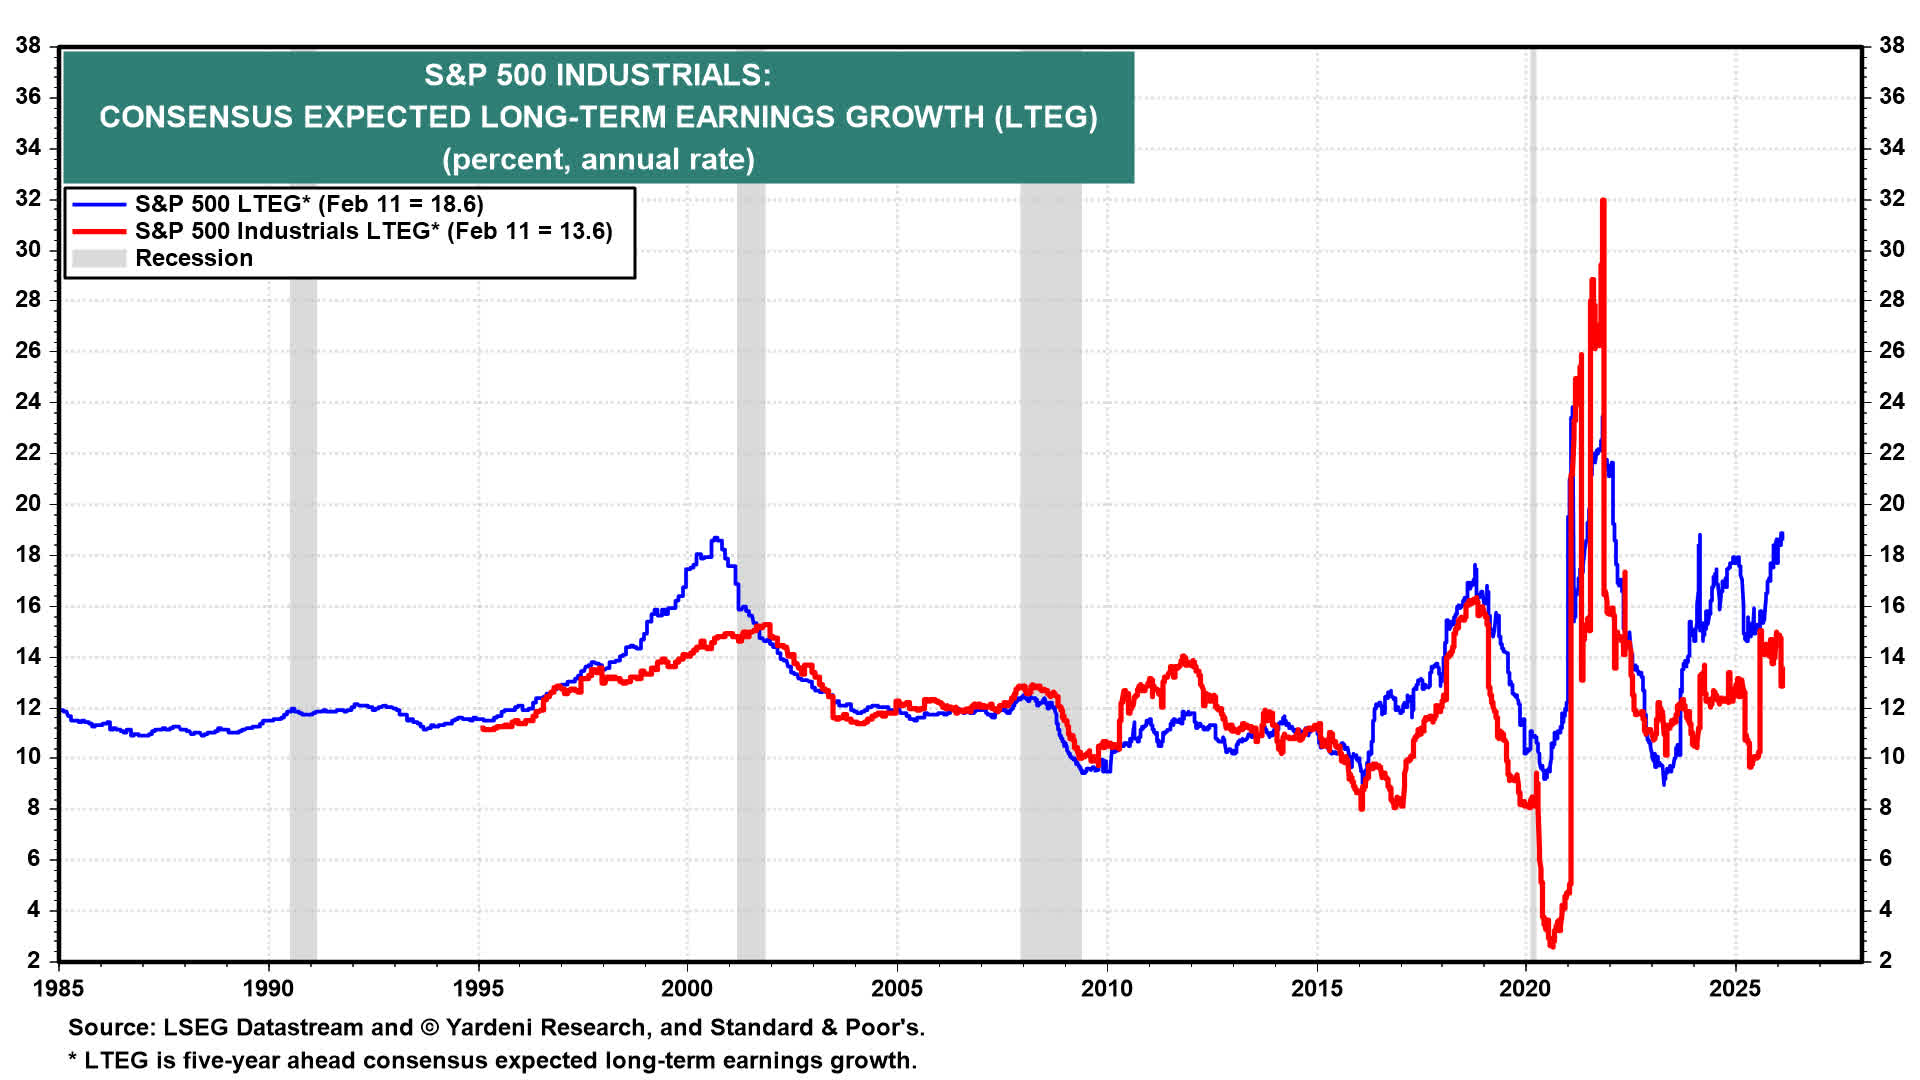
Yardeni reports long-term (next five years) earnings growth of a little over 7% annually for the staples sector, compared to almost 19% for the S&P 500.
Yardeni Research
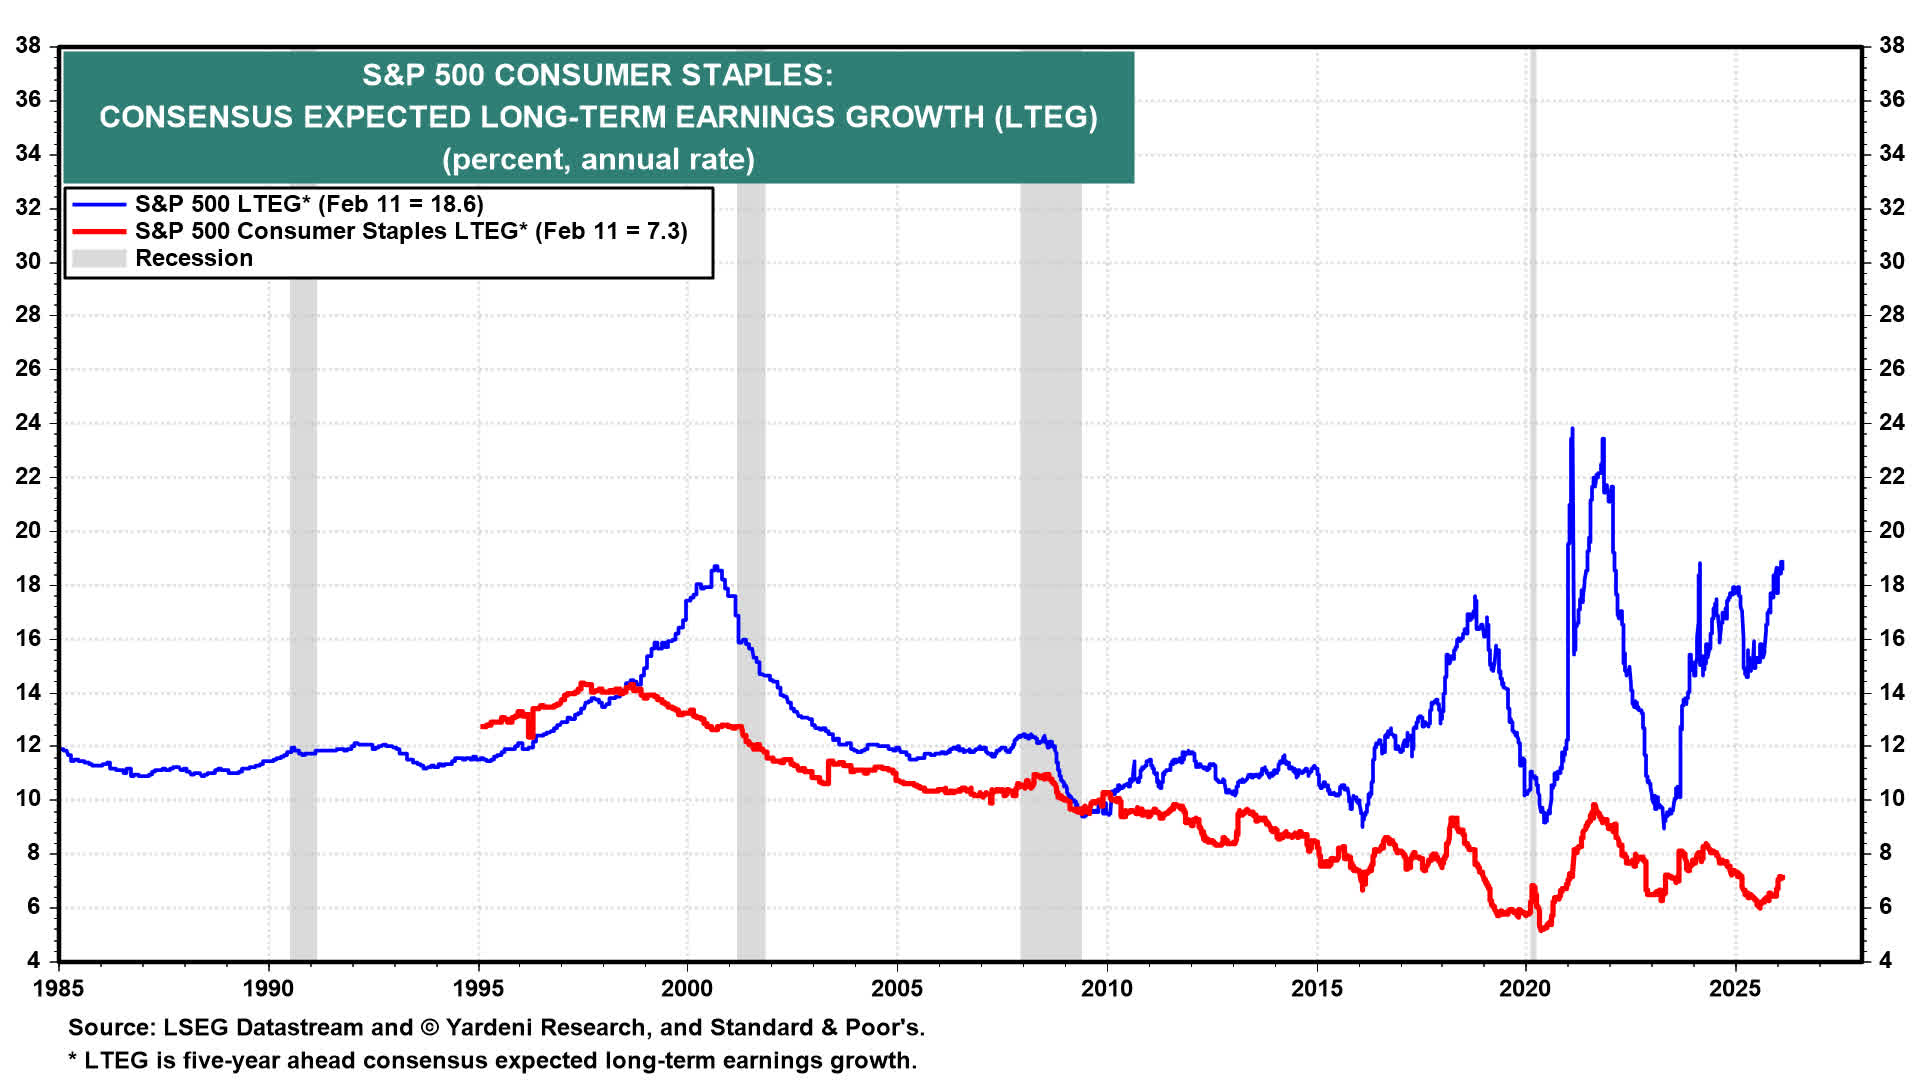
And yet, staples are valued higher today than the S&P 500!
How is this happening? Am I taking crazy pills? Is Wall Street taking crazy pills?
Let’s look under the hood of the staples index.
Together, Walmart (WMT), Costco (COST), Procter & Gamble (PG), and Coca-Cola (KO) account for about 35% of the consumer staples index.
Comparing these four staples giants’ forward earnings growth estimates against current valuations is striking.
Walmart Consensus Forward Earnings Forecast:
Seeking Alpha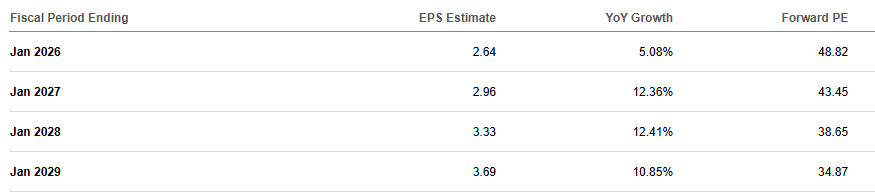
Costco Consensus Forward Earnings Forecast:
Seeking Alpha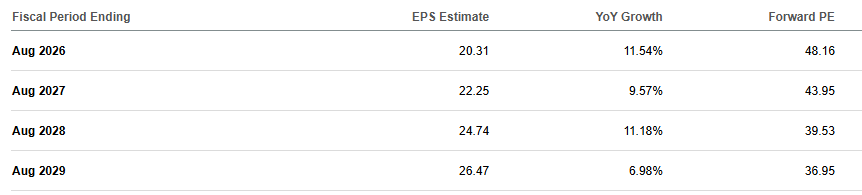
Procter & Gamble Consensus Forward Earnings Forecast:
Seeking Alpha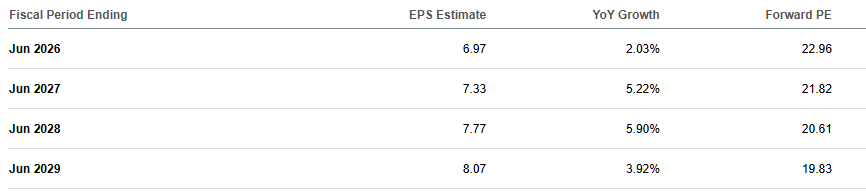
Coca-Cola Consensus Forward Earnings Forecast:
Seeking Alpha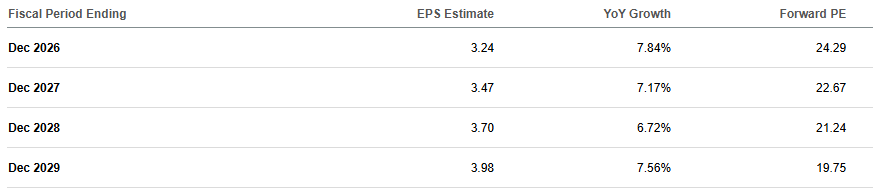
Walmart is undeniably a phenomenal company and stellar retailer, and analysts forecast double-digit earnings growth in 2027 and 2028. Still, it trades at almost 50x fiscal 2026 earnings. Even looking as far out as fiscal 2029 (February 2028 through January 2029), Walmart still sports a projected P/E ratio of ~35x.
Much the same story could be said about fellow retail stalwart Costco.
Are these retailers about to invent cures for cancer or commercially viable nuclear fusion? How in the world are they worth almost 50x earnings??
Likewise, Procter and Coca-Cola are giants in the consumer packaged goods space, and no one doubts their quality or stability. But their growth is in the single-digits. That growth rate is unlikely to meaningfully accelerate.
So how in the world are they worth 23-24x earnings??
In my view, that’s simply too much to pay for any company growing by single-digits.
It doesn’t feel like valuations matter to the market right now. All that matters is that AI can’t compete with the 60-pack of paper towels from Costco or the sensitive skin face wash from Procter & Gamble.
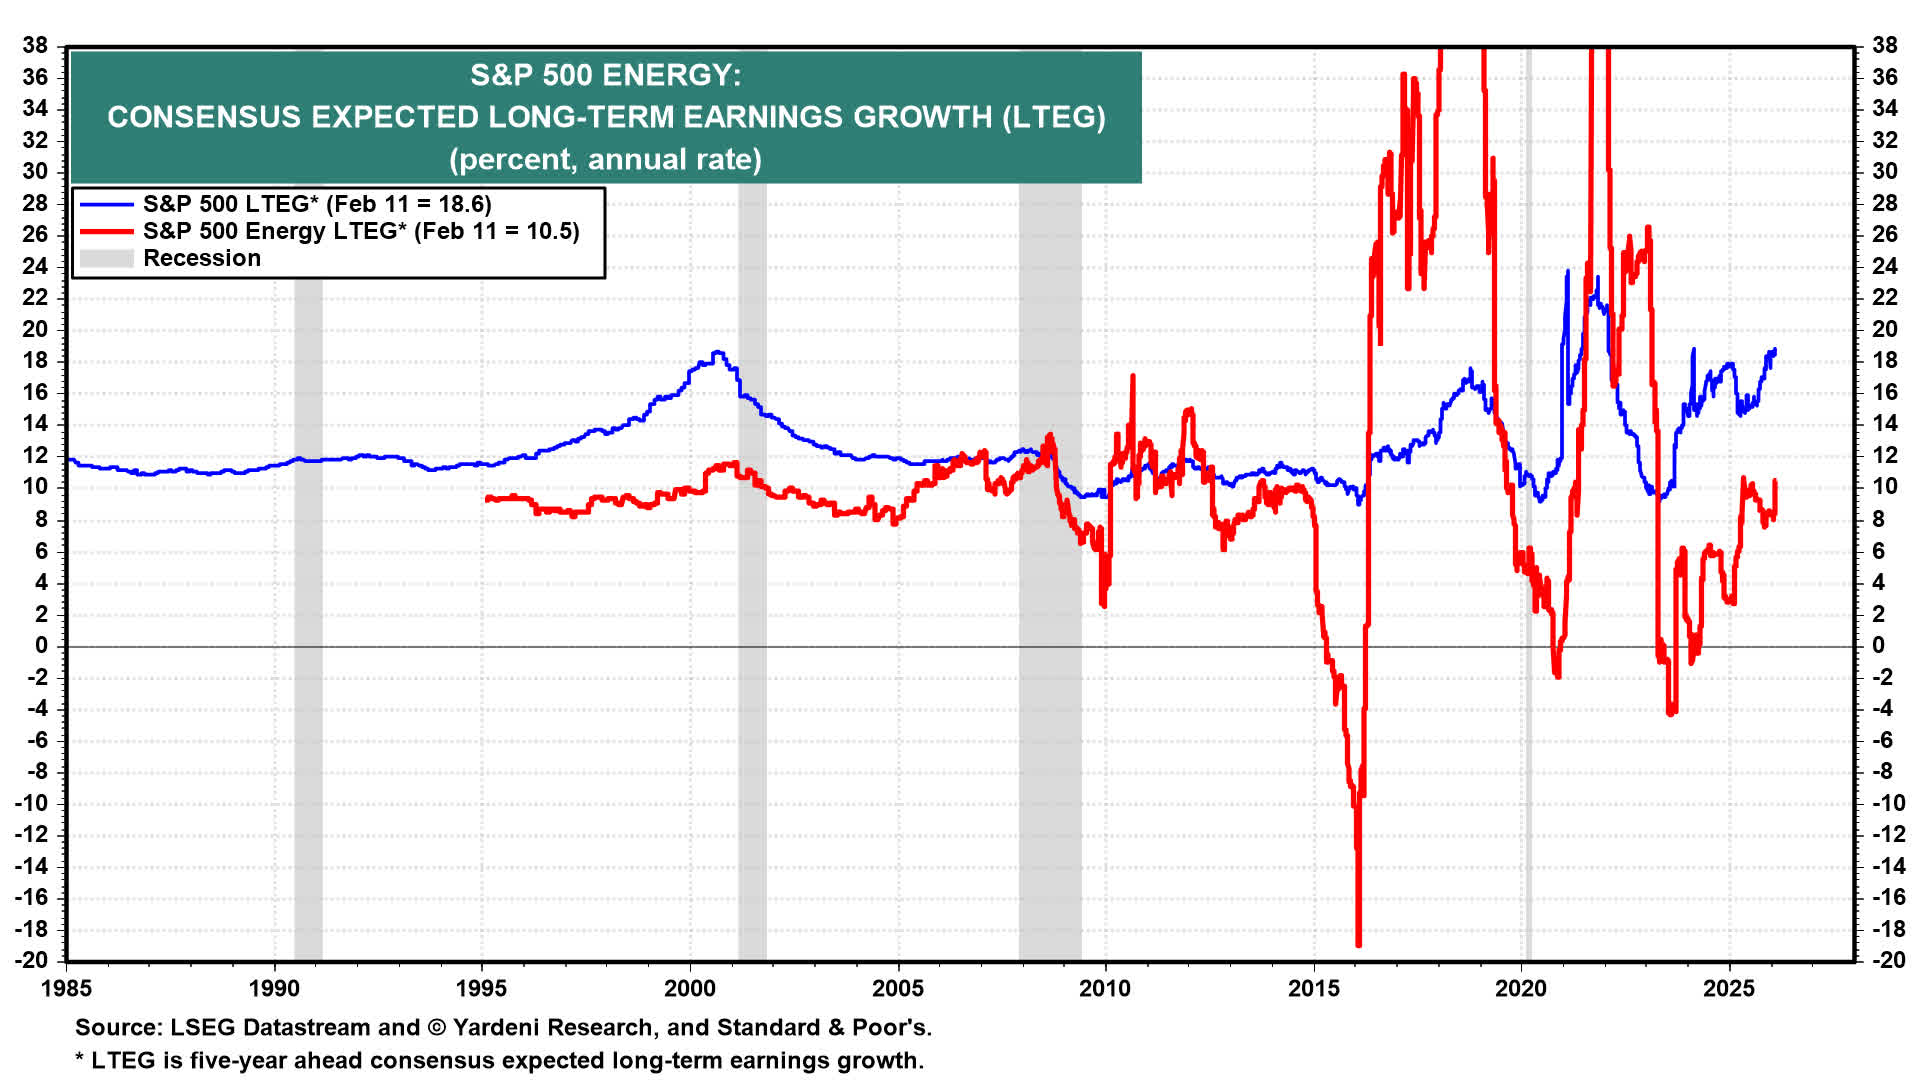
Something similar is happening with the energy sector (XLE), which now trades at a rare 20x forward P/E multiple.
Yardeni Research
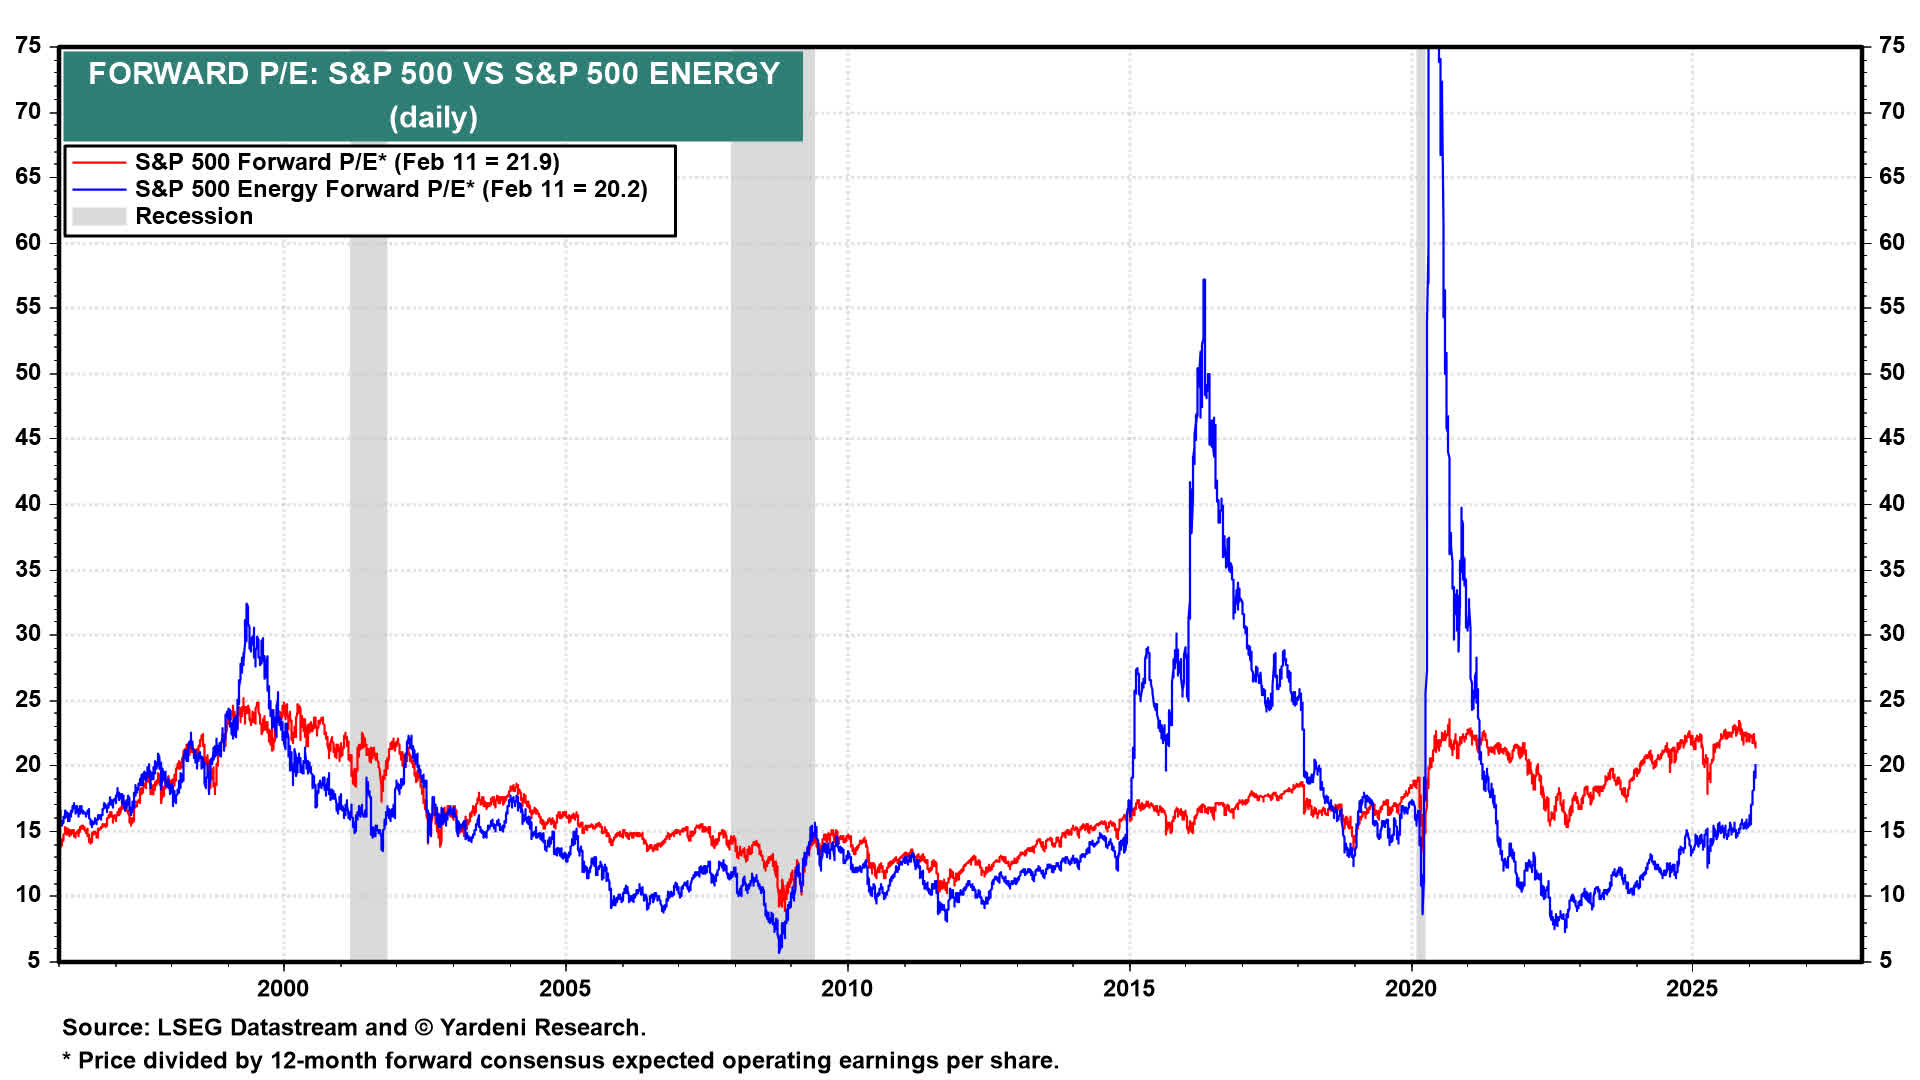
We haven’t seen this kind of valuation for the energy sector outside of a recession or energy glut (during which earnings collapse and deceptively push up P/E ratios) since the early 2000s.
Now, granted, the next-five-years earnings growth forecast for the energy sector looks pretty decent at about 10% annually.
Yardeni Research
But we have to remember how fickle and sensitive to commodity prices the energy sector is.
These analyst earnings projections could look very different in a few months or a few quarters.
The reason energy stocks tend not to trade at these lofty multiples is that the market, in its hive mind wisdom, knows the good times probably won’t last. It feels like the market has forgotten that right now.
Seemingly all that matters is that AI won’t be able to replace gas stations and petrochemical plants anytime soon.
Two Other Sector Winners Getting Overstretched
It’s not just the typically dividend-paying sectors seeing big bumps from the risk-off environment.
The materials (XLB) and industrials (XLI) sectors have also benefited.
At this point, the materials sector sports almost the same valuation as the S&P 500.
Yardeni Research
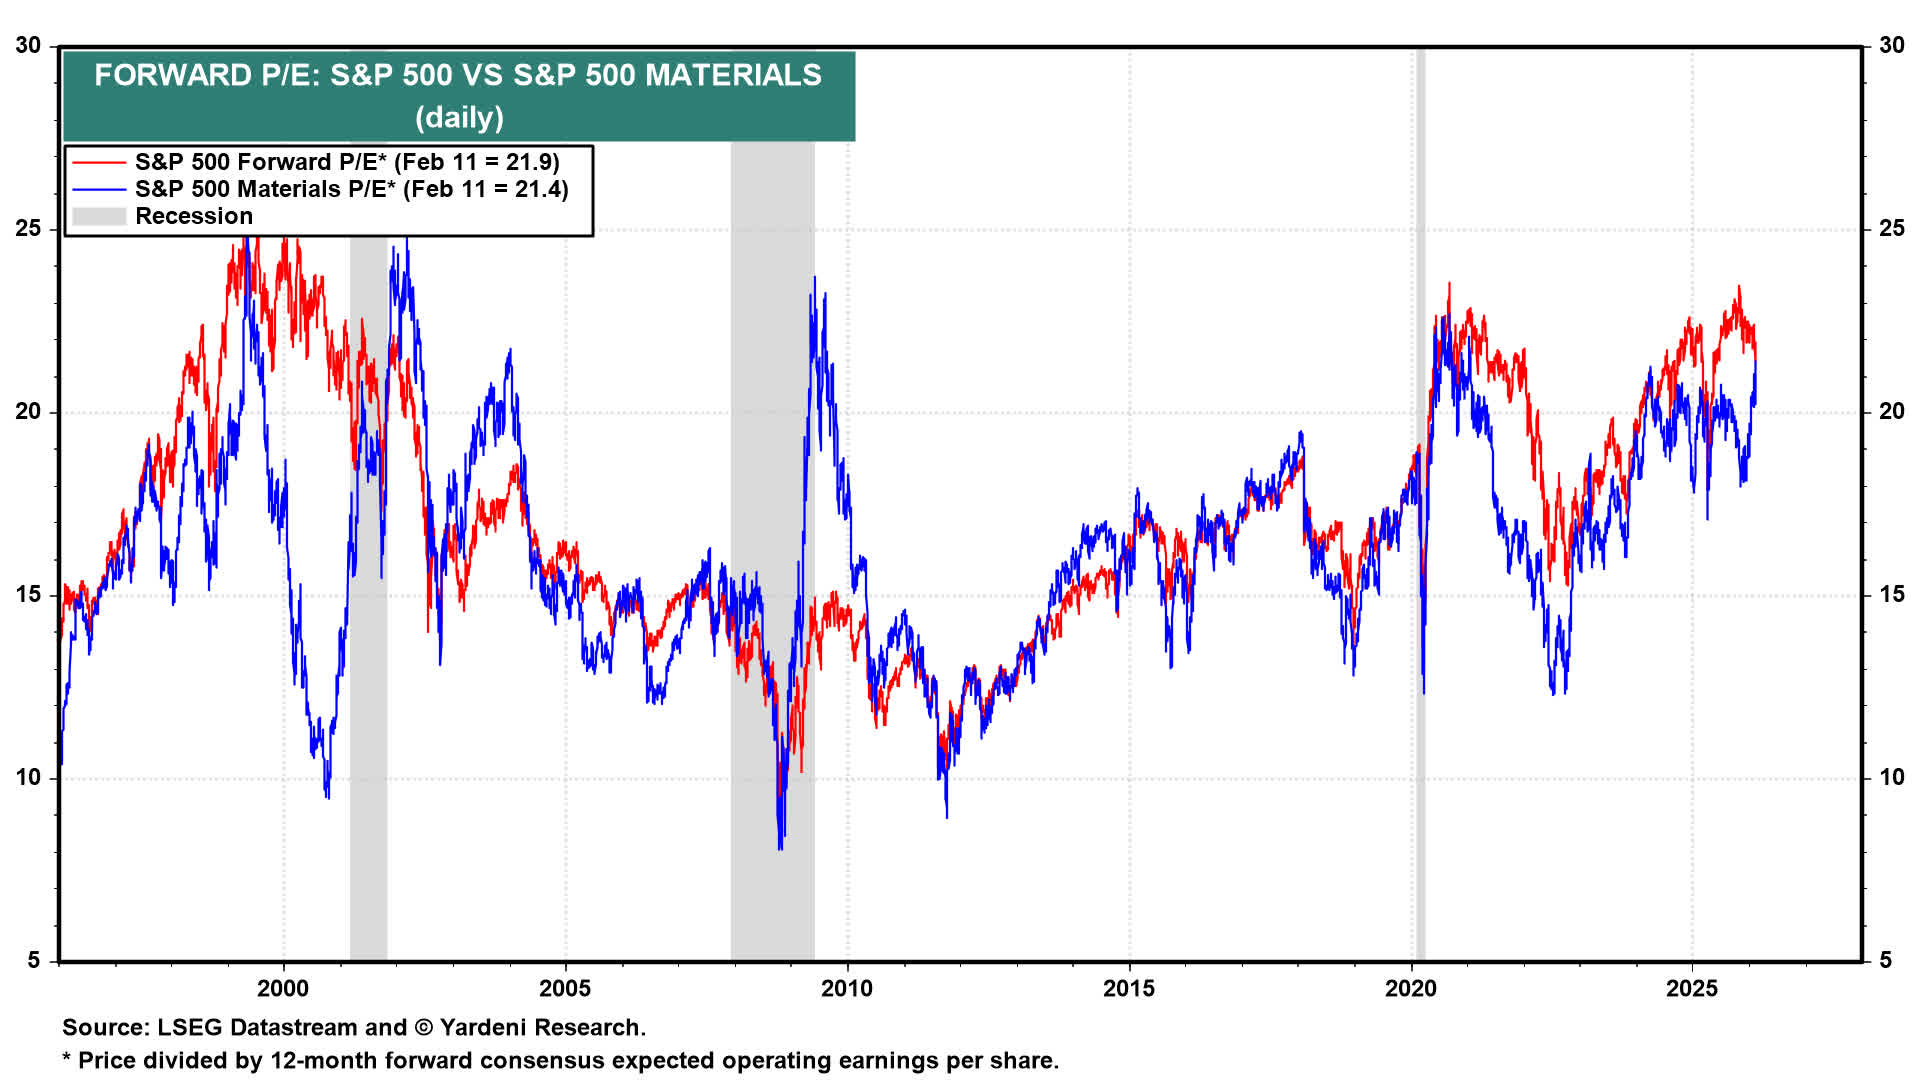
Now, to be fair, the materials sector usually trades fairly close in valuation to the broader market.
Also to be fair, the next-five-year outlook for materials’ earnings growth is pretty decent, perhaps influenced by the sheer amount of AI infrastructure spending already committed.
Yardeni Research
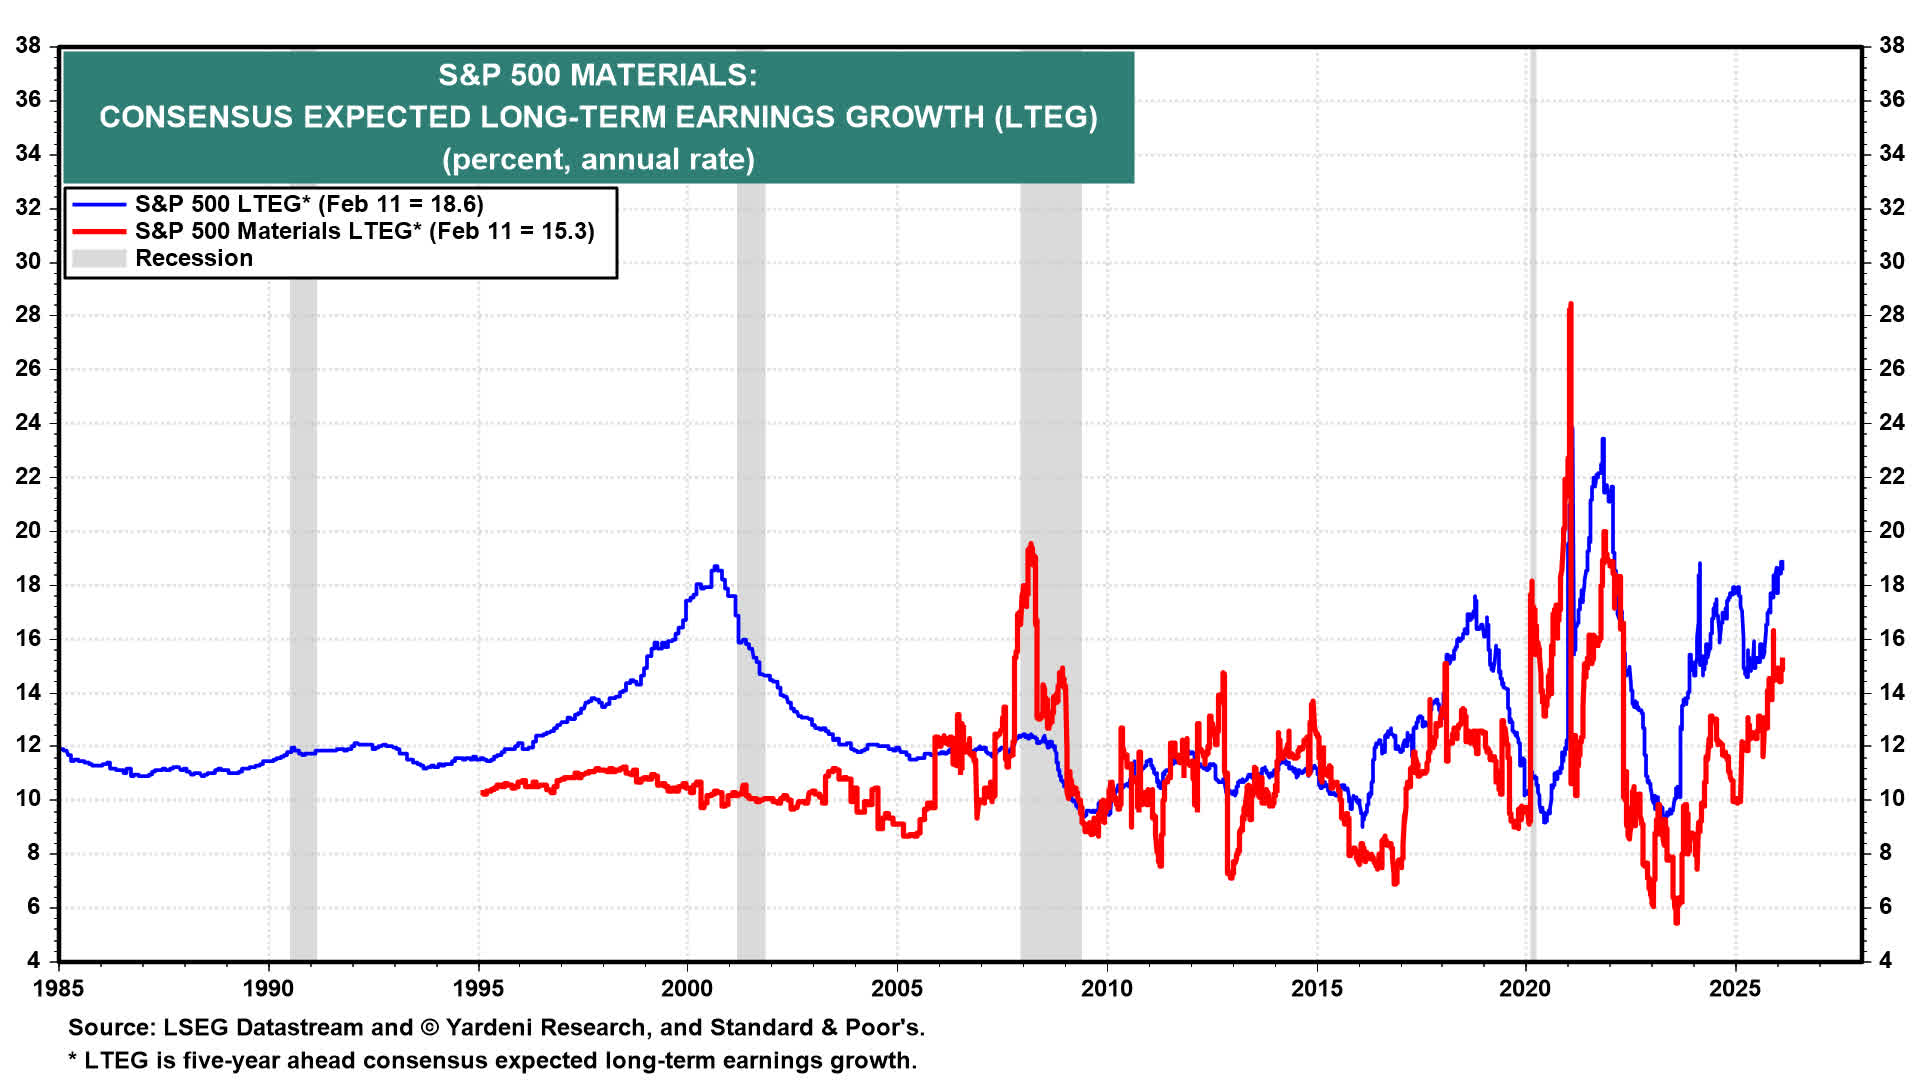
Even so, at the very least, I think we have to acknowledge that a lot of future earnings have been priced in to the materials sector.
That is even truer of the industrials sector, another beneficiary of AI infrastructure spending, which has seen its average valuation soar well past that of the broader market.
Yardeni Research
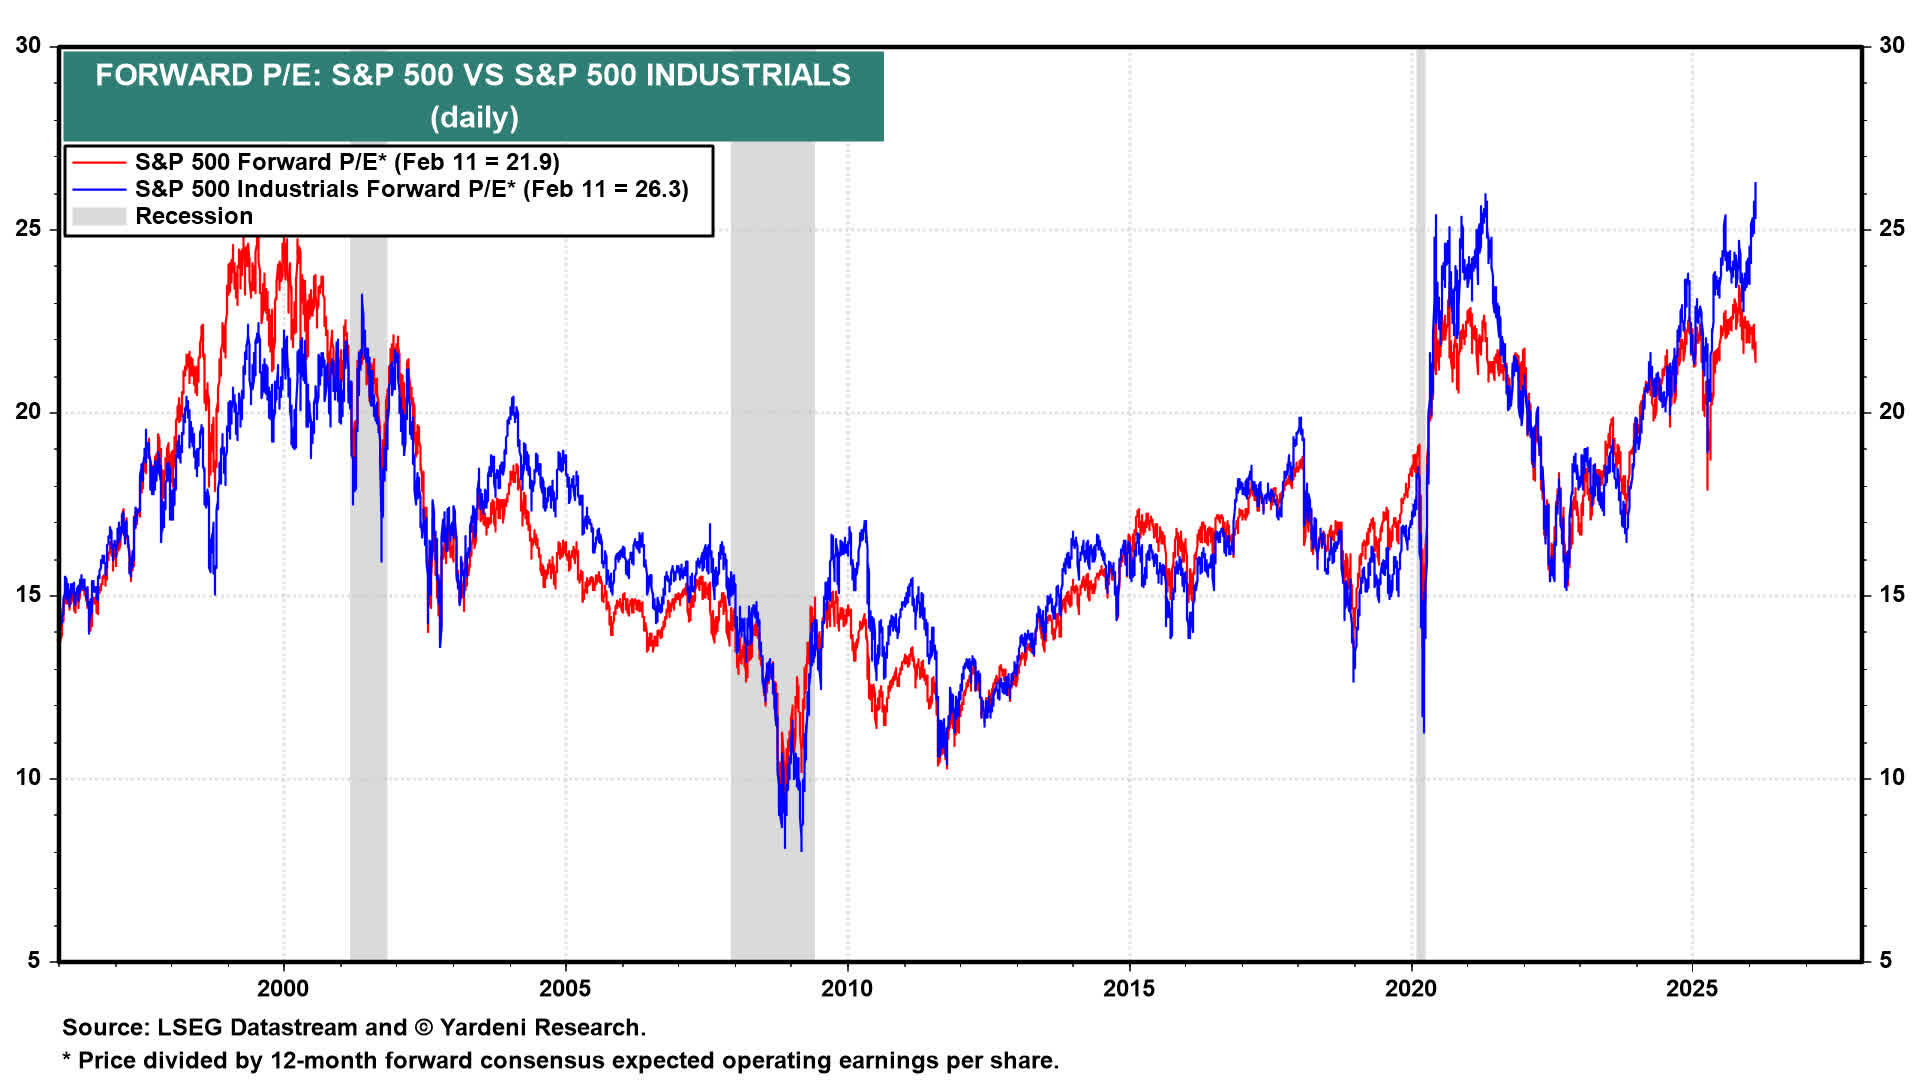
This is unusual, as industrials typically trade in fairly tight correlation to the broader market.
On the surface, it looks similar to the 2020-2021 period, when the post-COVID boom caused industrials valuations to surge well above that of the market.
Here, again, we find a fairly positive consensus earnings growth outlook for the industrials sector that looks more than priced in to stock valuations.
Yardeni Research
Combining industrials’ P/E ratio with its forward earnings growth outlook, we get a rough PEG ratio of almost 2x.
To my mind, that signifies that the good news is thoroughly priced in.
What I’m Buying Today
I’ve exhausted myself after all that cathartic ranting, so I’ll keep it brief here.
Given the lack of compelling buying opportunities across most of the market, I am now tilting heavily toward raising cash, with two notable exceptions.
| Dividend Yield | Plausible Dividend Growth Rate (Guesstimate) | |
| American Homes 4 Rent (AMH) | 3.8% | Mid-Single-Digit |
| VanEck Alternative Asset Manager ETF (GPZ) | 2.1% | Double-Digit |
| iShares Ultra Short Duration Active Bond ETF (ICSH) | 4.0% | N/A |
| Vanguard Ultra-Short Treasury ETF (VGUS) | 3.6% | N/A |
AMH is a high-quality single-family rental REIT with a geographically well-located portfolio (Sunbelt and Midwest), strong balance sheet, and internal development platform constantly delivering brand-new homes into the operating portfolio.
I think its lackluster stock performance is due to the ultra-low population and job growth over the last year or so. Occupancy and leasing have been solid in spite of this, but AMH is unlikely to enjoy another period of robust growth until population and job growth rebound.
I believe they will, but I don’t know how long that will take.
As for the alternative asset managers in the GPZ ETF, I will refer you to my recent standalone article on this ETF. It may be early, but I really like the long-term outlook for the major alternative asset managers and am fine with the 0.4% expense ratio for the luxury of buying them all in one package.
Lastly, raising cash for dry powder is a priority for me right now. I am not selling anything to raise cash but rather accumulating cash via dividends and unspent labor income.
ICSH is my favorite cash-equivalent vehicle, as it owns a variety of ultra-short duration fixed-income assets for a reasonable expense ratio of 0.08%.
But VGUS makes for an even more conservative cash-equivalent vehicle since it invests only in Treasuries. It comes with an expense ratio of 0.07%.
Enjoyed this article? Sign up for our newsletter to receive regular insights and stay connected.