
I think it’s hard for anyone with exposure to the stock market to overlook the semiconductor sector—whether you’re a long‑term investor or have a more trading-oriented mindset. Market headlines these days are often dominated by the “AI trade” and all the excitement surrounding it, ranging from AI‑bubble warnings to groundbreaking developments from well‑known names like OpenAI’s (OPENAI) ChatGPT, Anthropic’s (ANTHRO) Claude, Google’s (GOOG) Gemini, or Meta’s (META) open‑source LLMs.
In the end, however you look at AI, all roads sooner or later lead to one name: NVIDIA (NVDA). And deservedly so—none of these innovations would be possible without Nvidia’s technological breakthroughs. The simple way to put it is this: you can’t think without a brain, and Nvidia is building the brains for AI. That said, at its core, it remains a semiconductor company.
If Nvidia represents the central brain, the rest of the semiconductor ecosystem can be seen as the nervous system that brings AI to life. A brain can’t function in isolation; it needs a complex network to process data, transmit signals, and execute commands in the physical world. That’s where the other semiconductor players come in. Take the heavily discussed memory sector as an example – it has to react instantly to the massive data demands of LLMs. Or look at the fast‑evolving AI interfaces at the edge, where commands from the central cloud must be executed locally by countless regional nerve centers. From lightning‑fast memory chips to edge processors powering autonomous movements and real‑world actions, all of it relies on a wide range of semiconductors working seamlessly together.
To sum up, if we take the view that this AI highway isn’t slowing down or turning around but is instead accelerating, then it naturally brings with it a structural rebirth of the semiconductor industry. The sector is shifting from what has long been regarded as a largely cyclical business to one that is far less cyclical—and in some areas potentially becoming effectively non‑cyclical altogether.
One of the largest semiconductor ETF (SMH) managers, VanEck, offers the following view on the sector’s widely discussed cyclicality:
Historically, semiconductors were considered a cyclical industry, prone to dramatic booms and busts driven by PC and smartphone upgrade cycles. But that dynamic is rapidly changing.
The rise of AI data centers, enterprise cloud infrastructure, industrial automation, and automotive semiconductors has diversified the demand profile for chips. These segments are driven by sustained capital investment and long-term deployment, not short-term consumer behavior.
This shift has already triggered a powerful re‑rating in how markets value semiconductor companies. Put simply, cyclical businesses usually trade at P/E ratios around 5–10, while non‑cyclical growth companies often trade at 25–50—in some cases creating an almost 10× valuation gap. It’s therefore not surprising that names like Seagate (STX) and Western Digital (WDC)—companies viewed just a couple of years ago as cyclical cash cows—are flying high. Seagate, once even primarily seen as a mature dividend play with few growth prospects (yielding over 5% at the end of 2022), has seen its stock price explode recently, surging more than sixfold.
While I think the market has likely run quite a bit ahead of itself in these names, along with several others in the semiconductor space, they still serve as clear examples of the massive pricing shift currently playing out.
The next 1‑year chart shows how memory stocks—led by SanDisk’s astronomical 3,372% rise and followed by WDC, STX, and MU with gains in the 600–800% range—have massively outpaced both the broader semiconductor sector ETF, iShares Semiconductor ETF (SOXX), which returned 138%, and the sector’s bellwether, Nvidia, which rose just 67%.
Memory Stocks 1Y Rally (Seeking Alpha)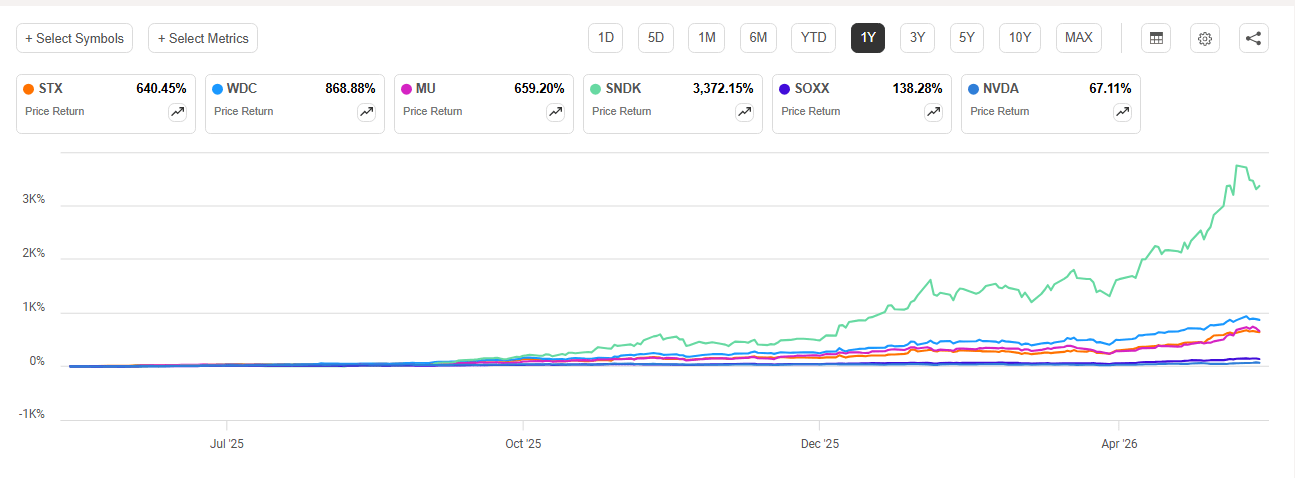
The massive repricing of memory makers could be seen as the main driver behind the impressive returns of semiconductor ETFs—and, more broadly, the technology sector—over the past year or so.
PwC, in its Global Semiconductor Industry Outlook 2026, also discusses the previous memory market cycles:
The memory market is famous for boom-and-bust “super-cycles.” A wave typically starts when a new platform—smartphones, cloud servers, AI accelerators—soaks up capacity, sending prices and margins soaring. Usually, suppliers over-build, inventories swell and a down-cycle follows.
Given the rocket‑like performance of memory stocks, I think it’s fair to conclude that the market has dramatically changed how it values memory makers and views their cyclicality.
Preparing for the Next Leg Up
While the semiconductor rally may have gone too far too fast, at least in some names, the broader structural outlook, in my view, remains undeniably strong. If we do get a correction along the way and the market offers better entry points, I believe it’s worth being ready to step in. That’s the reasoning behind taking a neutral stance on semis right now and focusing on comparing the most actively traded semiconductor ETFs—essentially having the homework done for when prices retreat and the time comes to start building positions again.
While many investors have their own favorite individual picks across the hundred or so publicly traded semis, many simply don’t have the time or inclination to dig deeply into individual names. Instead, they prefer sector‑focused ETFs, which—in addition to saving time—also provide the diversification needed to keep portfolio risk in check.
Here are the five most actively traded ETFs, along with their 3‑month average trading volumes, assets under management, and year‑to‑date returns:
| Ticker | ETF Name | Total Assets, billions | YTD Price Change | Avg. Daily Volume (3m) | Price |
| SMH | VanEck Semiconductor ETF | $63.93 | 54.48% | 9 434 497 | $556.34 |
| SOXX | iShares Semiconductor ETF | $35.03 | 68.96% | 7 450 308 | $508.52 |
| SOXQ | Invesco PHLX Semiconductor ETF | $2.06 | 63.68% | 1 318 283 | $91.18 |
| PSI | Invesco Semiconductors ETF | $2.48 | 88.08% | 320 122 | $148.32 |
| FTXL | First Trust Nasdaq Semiconductor ETF | $2.37 | 81.08% | 236 594 | $234.54 |
While SMH and SOXX clearly lead in average trading volumes and assets under management, the top year‑to‑date returns are actually coming from the less popular funds, PSI and FXTL.
Before digging deeper into the comparable funds’ other characteristics, I also put together a contextual comparison of the semis’ own “Mag 7” against the widely followed real Mag 7 to get a clearer sense of how much impact semiconductors actually have on markets more broadly. And as shown, the leader of both groups is the same—Nvidia.
| Semis Top 7 by Market Cap | Market Cap, USD trillions | Mag 7 | Market Cap, USD trillions |
| Nvidia | 5.4 | Nvidia | 5.4 |
| Broadcom | 2.0 | Alphabet | 4.8 |
| Taiwan Semiconductor | 1.8 | Apple | 4.4 |
| Micron | 0.9 | Microsoft | 3.2 |
| AMD | 0.7 | Amazon | 2.8 |
| Intel | 0.6 | Meta Platforms | 1.6 |
| ASML | 0.6 | Tesla | 1.6 |
| Total | 12.0 | Total | 23.8 |
| Nasdaq 100 | 35.4 | ||
| S&P 500 | 62.3 |
As seen in the table, the seven largest semis have roughly half the combined value of the Mag 7, accounting for around one‑third of the Nasdaq‑100 (NDX) and nearly one‑fifth of the S&P 500 (SP500). And given that there are eight more semiconductor names valued above $100 billion, it clearly underscores the sector’s substantial influence on both the broader technology indices and the overall market.
I think it’s fairly obvious that, given how impactful the semiconductor group has become, the market’s latest run—despite all the geopolitical and macro headwinds—has been strongly supported by the sector’s exceptional performance, ongoing revaluation, and the latest round of strong earnings.
The one-year chart comparing major indexes to top semiconductor ETFs clearly illustrates this, with the latter outperforming the broader market several times over:
Semis Outperformance of QQQ;SPY (Seeking Alpha)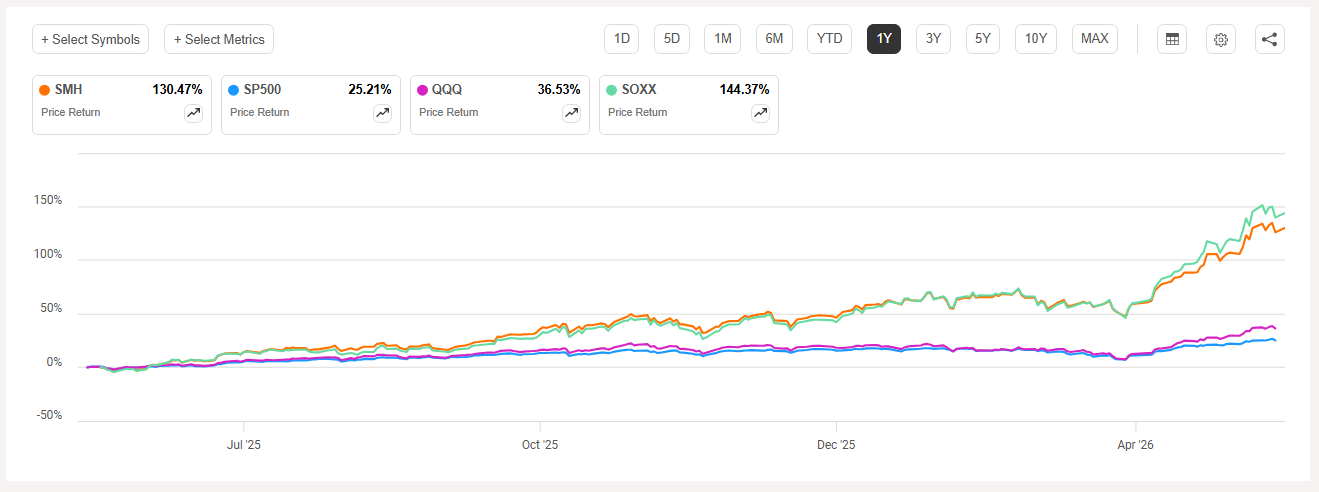
Fund Comparison Tables
At first, I think it’s important to look at the funds’ holdings. As seen in the following table, the holdings differ quite a bit, which helps explain the variability in returns.
Semi ETFs Holdings (Author’s Creation)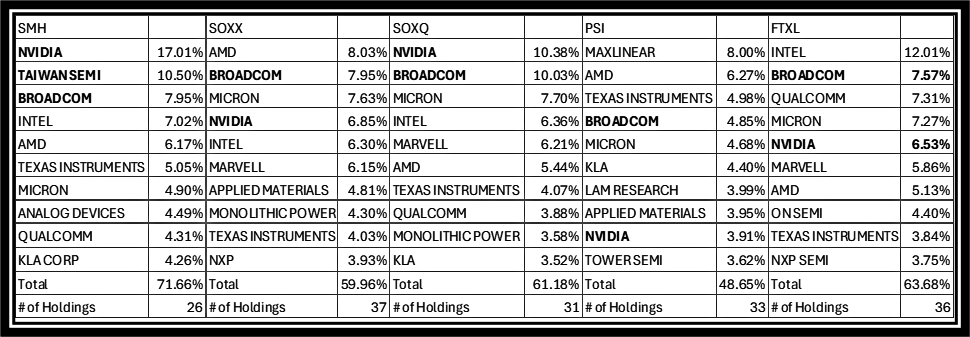
I also highlighted in bold the positions of the three largest semiconductor names in each fund to give an even clearer overview. Somewhat surprisingly, Taiwan Semi appears in the Top 10 only in SMH. Another notable detail, in my view, is that in SMH, Nvidia clearly dominates with a 17% allocation, while in the other funds it is not the largest position—except in SOXQ, where it sits alongside Broadcom at roughly a 10% weight. That dynamic also helps explain why SMH has lagged the other funds in the one‑year comparison yet leads over the three‑ and five‑year periods, as Nvidia’s performance has been much more moderate over the past year compared with other semis.
In the table that follows, you can also see that each of these ETFs tracks a different index. It also presents additional key details, with each fund’s strengths highlighted in bold:
| Ticker | SMH | SOXX | SOXQ | PSI | FTXL |
| Issuer | Van Eck | BlackRock | Invesco | Invesco | First Trust |
| Date of Inception | 2011 | 2001 | 2021 | 2005 | 2016 |
| Benchmark Index | MVIS US Listed Semi 25 | NYSE Semiconductor | PHLX Semiconductor Sector | Dynamic Semiconductor Intellidex℠ | Nasdaq US Smart Semiconductor™ |
| 1Y Total Return | 125.8% | 139.8% | 136.0% | 174.8% | 174.0% |
| 3Y Total Return | 347.1% | 269.0% | 287.0% | 291.7% | 291.7% |
| 5Y Total Return | 397.0% | 296.0% | 277.3% | 299.2% | 303.9% |
| Dividend Yield | 0.2% | 0.3% | 0.3% | 0.1% | 0.2% |
| Options | Weekly | Weekly | Monthly | Monthly | Monthly |
| Expense Ratio | 0.35% | 0.34% | 0.19% | 0.56% | 0.60% |
| Beta 3Y | 1.84 | 1.89 | 2.15 | 1.79 | 1.98 |
| Volatility | 29.80% | 32.90% | 32.60% | 36.80% | 34.70% |
| Trailing P/E | 45 | 71 | 47 | 37.6 | 42.7 |
In my view, the key difference between these funds, aside from daily trading volume and assets under management, is their allocation to Nvidia. SMH’s larger exposure to Nvidia sets it apart in terms of returns, outperforming others over the long term but lagging in the short term as Nvidia’s rally has recently moderated.
Dividends are so low that, in my opinion, they’re basically irrelevant. Volatility and beta are informative, but I prefer not to put much weight on them either. For example, SOXQ has the highest beta yet shows average volatility, which is hardly useful data taken together. The easiest way I assess fund risks is by comparing the number of holdings and the Top 10 allocations. SOXX stands out with the highest total holdings, while PSI leads with the lowest percentage in the Top 10 allocation.
I don’t think the trailing P/E is a particularly significant factor either, especially since the whole semiconductor story is more about growth and future earnings. Moreover, fund webpages, while listing P/E figures, don’t clarify whether these are based on GAAP or non-GAAP calculations, which further undermines the value of that data.
In short, what matters most to me is liquidity—average daily trading volume. This is especially relevant for options: semiconductors are highly volatile, and I often use options as a hedge, and options activity tends to follow the underlying volume. From that perspective, SMH is the clear winner. Both SMH and SOXX have weekly options, but SMH’s volumes typically run about five to six times higher.
From a diversification perspective, SOXX seems like a better long-term option, but investors have to accept the relatively low Nvidia exposure at around 7% compared to SMH’s 17%.
SOXQ stands out with its lower expense ratio, but otherwise it’s hard to see a clear advantage. Its benchmark, the widely followed Philadelphia Semiconductor Index, was the first to track the semiconductor sector when it launched back in 1993, which could be seen as a key differentiator.
PSI and FTXL are solid funds that have outperformed others over the past year, and if an investor doesn’t mind their lower trading volumes and higher expense ratios and likes their allocations, they’re great bets for sector growth, too.
Takeaway
Just as I was wrapping up this article on May 18, the correction in semiconductors picked up momentum, with the PHLX Semiconductor Index down about 4%, having retreated roughly 8% from the all‑time highs reached just last week. I don’t think that’s enough to justify stepping in yet, considering the significant uncertainties around the Iran crisis, on top of the semis’ own need for further correction to make the fundamental side more attractive.
Another factor keeping me on the sidelines is Nvidia’s upcoming earnings. While I believe it’s a beat‑and‑raise event, the details discussed in the conference call will be key and could set the tone for the entire semiconductor sector.
For me, SMH remains the preferred vehicle when it’s time to make a move, that said, all five funds have their own strengths, and investors should choose the one that best aligns with their strategy.
Enjoyed this article? Sign up for our newsletter to receive regular insights and stay connected.