
VBK Strategy
Vanguard Small-Cap Growth Index Fund ETF (VBK) was launched on 01/26/2004 and tracks the CRSP US Small Cap Growth Index. VBK has a portfolio of 550 stocks, a 30-day SEC yield of 0.46%, and an expense ratio of 0.05%. The same strategy is also available as a mutual fund, Vanguard Small-Cap Growth Index Fund Adm (VSGAX).
VBK has changed underlying indexes twice: it was tracking the S&P SmallCap 600 Growth Index in 2004-2005, then the MSCI US Small Cap Growth Index from 2005 to 2013, and finally the current index since 4/17/2013.
As described by CRSP, the underlying index “represents the growth style for companies covering 85% to 98% of the cumulative capitalization of the CRSP US Total Market.” It is rebalanced quarterly. The fund’s turnover rate was 24% in the most recent fiscal year. I will use as a benchmark the parent index CRSP US Small Cap Index, represented by Vanguard Small-Cap Index Fund ETF (VB).
VBK Portfolio
The portfolio has significant exposure in industrials (25.2% of asset value) and technology (20.9%). Compared to the parent index, VBK overweights mostly technology and healthcare, while it downplays financials, real estate, and utilities.
VBK sector breakdown (Chart: author; data: Vanguard)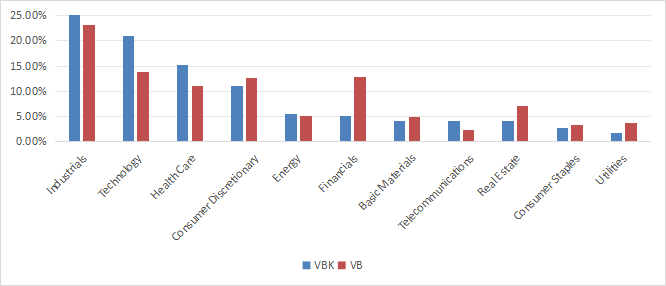
The fund is very diversified and has low company-specific risk. The top 10 holdings, listed in the next table, represent 9.3% of asset value, and the heaviest position weighs 1.1%.
| Ticker | Name | Weight |
| BE | Bloom Energy Corporation | 1.11% |
| CIEN | Ciena Corporation | 1.10% |
| FIX | Comfort Systems USA, Inc. | 0.95% |
| LITE | Lumentum Holdings Inc. | 0.95% |
| CASY | Casey’s General Stores, Inc. | 0.90% |
| FTI | TechnipFMC plc | 0.89% |
| COHR | Coherent Corp. | 0.88% |
| RVMD | Revolution Medicines, Inc. | 0.84% |
| CRDO | Credo Technology Group Holding Ltd. | 0.83% |
| ALAB | Astera Labs, Inc. | 0.83% |
Fundamentals
As reported in the next table, VBK is more expensive than the benchmark based on valuation ratios and has significantly higher growth rates, in accordance with its strategy and its “Small Growth” classification.
| VBK | VB | |
| P/E TTM | 30.41 | 21.24 |
| Price/Book | 4.86 | 2.64 |
| Price/Sales | 3 | 1.56 |
| Price/Cash Flow | 17.59 | 12.17 |
| Earnings growth | 17.14% | 5.83% |
| Sales growth % | 8.21% | 3.95% |
| Cash flow growth % | 13.08% | 4.11% |
Data: Fidelity
Performance
VBK is on par with VB since it started the current strategy in April 2013, with slightly higher volatility but a shallower maximum drawdown.
| From 4/24/13 | Total Return | Annual Return | Drawdown | Sharpe Ratio | Volatility |
| VBK | 282.79% | 10.81% | -38.70% | 0.53 | 18.81% |
| VB | 283.06% | 10.82% | -42.05% | 0.56 | 18.14% |
Data: Portfolio123
VBK is 3.3% ahead of VB over the past 12 months:
| 12 months | Total Return | Drawdown | Sharpe Ratio | Volatility |
| VBK | 30.52% | -11.44% | 1.73 | 13.81% |
| VB | 27.24% | -8.98% | 1.87 | 12.01% |
VBK vs. Competitors
The next table compares characteristics of VBK and five small-cap growth ETFs:
- iShares S&P Small-Cap 600 Growth ETF (IJT).
- iShares Russell 2000 Growth ETF (IWO).
- iShares Morningstar Small-Cap Growth ETF (ISCG).
- First Trust Small Cap Growth AlphaDEX Fund ETF (FYC).
- Janus Henderson Small Cap Growth Alpha ETF (JSML).
This list is not intended to be exhaustive.
| VBK | IJT | IWO | ISCG | FYC | JSML | |
| Inception | 01/26/2004 | 07/24/2000 | 07/24/2000 | 06/28/2004 | 04/19/2011 | 02/23/2016 |
| Expense Ratio | 0.05% | 0.18% | 0.24% | 0.06% | 0.70% | 0.30% |
| AUM | $22.38B | $7.38B | $14.10B | $952.88M | $1.09B | $320.56M |
| Avg Daily Volume | $78.68M | $20.03M | $166.72M | $2.82M | $7.13M | $1.27M |
| Holdings | 551 | 343 | 1098 | 956 | 263 | 119 |
| Top 10 | 9.30% | 17.60% | 24.43% | 17.70% | 9.34% | 20.90% |
| Turnover | 24.00% | 52.00% | 30.00% | 42.00% | 137.00% | 170.00% |
| Total Return* | 219.29% | 196.39% | 206.07% | 215.50% | 304.91% | 241.83% |
| Annual Return* | 12.03% | 11.22% | 11.57% | 11.90% | 14.67% | 12.78% |
| Drawdown* | -38.70% | -42.03% | -42.01% | -41.48% | -47.85% | -39.64% |
| Sharpe Ratio* | 0.53 | 0.5 | 0.5 | 0.53 | 0.61 | 0.52 |
| Volatility* | 19.95% | 20.06% | 21.21% | 19.84% | 21.93% | 23.10% |
*Calculated with Portfolio123 from 3/2/2016 to match inception dates.
VBK is the largest fund on this list and has the lowest expense ratio. Nonetheless, it is in second position behind IWO for liquidity. It also ranks second for total return and Sharpe ratio since March 2016. FYC leads by a significant margin, although it is more volatile.
Takeaway
Vanguard Small-Cap Growth Index Fund ETF (VBK) holds over 500 small caps with growth characteristics. The portfolio has low company-specific risk but notable sector risk in industrials and technology. VBK is on par with VB since it started tracking its current index in 2013, with no long-term edge compared to the broad small-cap ETF. Although VBK’s appeal as a long-term holding is limited, it is well-suited for tactical allocation to the growth factor in small caps. However, based on 10-year returns, key competitor FYC may be a better option.
Enjoyed this article? Sign up for our newsletter to receive regular insights and stay connected.