
The Private Credit Chart Nobody Is Paying Attention To, But Could Change Everything

For long-term investors, the key question is not whether private credit is “safe” or “broken,” but how the vehicle behaves under stress. Public BDCs, direct-lending funds and listed alternative managers may all be exposed to the same credit cycle, yet they do not offer the same mix of liquidity, pricing transparency or balance-sheet flexibility. That matters when sentiment shifts, because the market can mark down the wrapper faster than the underlying loan book changes.
That creates a valuation gap worth separating from a fundamental gap. A discount to NAV can reflect real caution about future losses, but it can also reflect forced-selling fears, redemption pressure and investor aversion to opacity. For portfolio construction, the issue is whether that discount is compensating you for actual asset risk or simply for the market’s dislike of the structure and its cash-flow mechanics.
Another important lens is concentration. Private credit is often discussed as a single asset class, but borrower size, sector mix and seniority can produce very different outcomes. A portfolio dominated by first-lien loans to larger borrowers may behave differently from one with more exposure to smaller companies or weaker documentation. Investors should be cautious about treating “private credit” as a monolith when underwriting quality and covenant protection can vary meaningfully.
Finally, this is a reminder that income vehicles need to be assessed on two timelines: near-term mark-to-market volatility and longer-term realized credit outcomes. When liquidity is available and NAVs are reported quarterly, short-term price moves can overshoot the actual deterioration in loan performance. That does not eliminate risk, but it does mean disciplined allocation and diversification matter more than reacting to headlines alone.
Thus far this year, the general media and market consensus has been that the software industry (IGV) is about to get severely disrupted by AI, and defaults are about to spike into distressed territory for many BDCs (BIZD) and direct lending private funds. The result of this sentiment has been that redemption requests from private funds have surged, forcing many of these funds to enforce their gates on total redemptions per quarter in order to preserve fund liquidity and long-term returns by avoiding forced selling.
Additionally, publicly traded BDCs (PBDC) have traded down materially this year, with even leading blue chip BDCs like Ares Capital Corporation (ARCC), Blackstone Secured Lending (BXSL), and Golub Capital BDC (GBDC), all of which have traded at premiums to NAV in the not-too-distant past, now trading at discounts to NAV. Even Blue Owl Capital Corporation (OBDC), which just a year ago was trading at a premium to NAV, is now trading at a huge discount to NAV as capital has fled the sector.
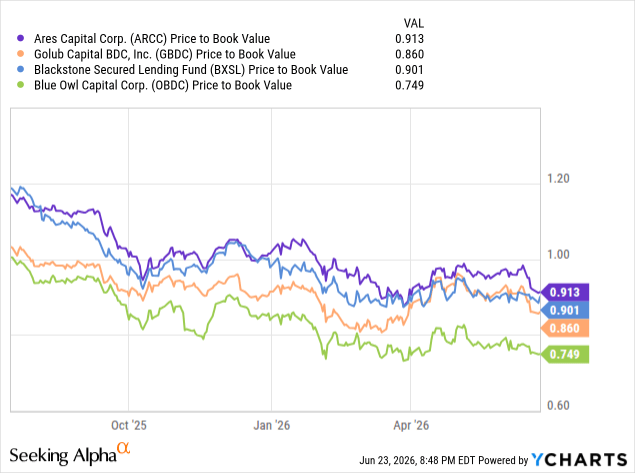
However, when you actually sit down and look at the data, the outlook for the BDC space becomes much more nuanced. For value investors who look at the price you’re paying for something as an important consideration when deciding whether to buy a stock, there’s an argument to be made that private credit, especially in public market vehicles (whether it be through alternative asset managers like Ares Management (ARES), Blue Owl Capital (OWL), or Blackstone (BX), or directly via publicly traded BDCs), could be a compelling buy right now.
In this article, I will look at one chart in particular that helps provide an answer to this question, namely the Cliffwater Direct Lending Index (“CDLI”), which tracks over $500 billion in loans. The CDLI is currently reporting losses that are quite modest compared to the rhetoric being expressed about the sector in the financial media and the sentiment that is being expressed in public market valuations and in the elevated level of redemption requests from private credit funds.
The Bears Are Overreacting To Modest Weakness
First of all, don’t get me wrong: private credit performance has weakened somewhat recently, as unrealized losses did increase slightly in the CDLI in Q1. Many BDCs so far this year have reported declining NAVs, NII per share, and dividends due to a combination of declining base rates late last year from Federal Reserve rate cuts and spread widening. This has weakened NAV per share in light of weakening sentiment in the sector and elevated redemptions, along with slowing fundraising in private credit funds. However, the evidence shows, in my view, that the bears and the market are overreacting to these developments.
The chart that demonstrates this is that trailing twelve month realized losses in the private credit space remain at just 0.58%, which remains well below historical averages of about 1%. Additionally, even though unrealized losses in Q1 came in at 1.07%, realized losses this quarter were extremely low at just 0.11%, which annualizes to 0.44%.

CDLI
Therefore, realized losses are actually decelerating, not accelerating as the headlines and market sentiment would have investors believe. It’s also worth noting that much of the unrealized losses in Q1 were due to spread widening and not actually due to weakening fundamentals. In fact, software markdowns accounted for 60 of the 107 basis points of unrealized losses during the quarter. Thus, the market is treating headline unrealized losses as if they were already realized losses due to a surge in defaults, when in reality it was primarily driven by sentiment souring on the software sector.
In fact, in Q4 2025, the sector had a stress rate of 3.5% with realized losses of about 0.58%, which implies recoveries are about 84%. The reason recoveries are so strong is that the vast majority of these loans are first-lien senior secured, therefore providing significant buffers against outsized principal losses in the case of distress in the borrower. Thus, when combined with the high yield, trailing 12-month total returns have been 8.19% in this index, which is quite strong compared to peers like high-yield debt (JNK) and leveraged loans. That’s even with rising markdowns, especially on software loans where spreads widen particularly sharply. The overall return proposition and underlying fundamental health of the sector on a go-forward basis remain fairly compelling. In fact, the CDLI has delivered a 9.5% average annualized return since its inception, with only one year of actual losses in its 21-year history (2008, during the Great Financial Crisis). Moreover, the CDLI has outperformed the Morningstar LSTA US Leverage Loan Index by almost 450 basis points per year over 21 years, while also outperforming it by ~250 basis points in Q1 alone.
The Stress Is Concentrated At The Bottom Of The Market
Additionally, the stress that is being reported as being elevated is being driven by just a few concentrated issues, while the remainder of the direct lending space has seen solid performance. In fact, companies with $100 million+ in EBITDA that borrow from direct lenders are showing a covenant default rate of just 1.4%, which is below recent averages. Meanwhile, J.P. Morgan research reveals that defaults are primarily concentrated in the $25 to $50 million EBITDA companies. Tech and software defaults are remaining relatively muted as well, even within that $25 to $50 million EBITDA range, indicating that AI disruption of the sector has yet to appear.
Meanwhile, the major BDC managers that have been most under pressure this year, such as Blue Owl funds and Blackstone’s BCRED, operate at the high end of the EBITDA ranges. For example, Blue Owl’s OCIC has a weighted average borrower EBITDA of $297 million, and its OTIC has a weighted average borrower EBITDA of $377 million. Thus, while the bottom of the market is driving the numbers that are causing the market to panic, the major lenders whose stocks are the main publicly traded vehicles getting hit hard are actually lending at the top of the market, where results are much stronger.
The Loan-Level Data Paints An Even Stronger Picture
This bears out not only in the headline numbers but actually in the fund-level specific numbers. For example, the loan-to-value ratios and leverage BDCs are in the 35 to 40% range. At BCRED it’s at 37%, OTIC is at 35%, and OCIC is at 40% during initial underwriting. Thus, for lenders to lose any money on these loans, the borrowers’ enterprise value needs to collapse by 60–65% from the point of underwriting. While it is true that many software companies have seen major haircuts to their equity valuations over the past 6–12 months, the declines are nowhere near enough, in general, to warrant impairment of first-lien senior secured loans written at 35–40% LTV thus far. This is especially true given that the overall performance of software companies in their loan books continues to be quite strong in aggregate.
In fact, OTIC’s portfolio companies saw their revenue increase by more than 10% year-over-year and EBITDA up by more than 14% year-over-year, while OCIC portfolio companies have seen revenue up by 9% and EBITDA up by 10%. BCRED has seen average EBITDA growth of 10%, with interest coverage ratios actually improving by 25% compared to a year ago, in part due to declining base rates. It is also worth keeping in mind that software is not a monolith, and that leading senior secured lenders, whether it be OWL, ARES, ARCC, BX, or others, are generally focusing on mission-critical companies and regulated industries where their software is deeply embedded in their clients’ operations and has high switching costs, with AI actually presenting a growth opportunity and margin enhancement opportunity rather than a disruption headwind in many cases. The strong growth numbers and fundamentals in their software books thus far support this argument as well.
This Is Nothing Like The 2008 Financial Crisis
Last but not least, it is also worth noting that for those comparing private credit to leveraged loans in the lead up to the Great Financial Crisis, back then banks were levered by 25 to 40x and were funding long-term, risky assets with overnight deposits, including at 90%+ loan delinquencies on subprime borrowers.
Today, BDCs operate at around 1x leverage on average, and some of the leading BDCs making headlines, such as OTIC and OCIC, have leverage of around 0.8x, which is below their own internal target ranges and the broader industry averages, thereby giving them additional flexibility. On top of that, they have immense liquidity, with OCIC having 11x liquidity coverage of its tender obligation and OTIC having 7x liquidity coverage of its tender obligations. This means that they are at very low risk of having to engage in forced selling that would lead to potentially outsized losses for shareholders. For those who question the transparency of these books, BDCs still have to register with the SEC and have third-party appraisers value their books every quarter, which actually provides more transparency than traditional bank lenders, who disclose no underlying loan details.
Why Smart Investors Are Quietly Buying The BDC Panic While Everyone Else Runs For The Exits
Thus, while I do believe that fundamentals are slightly degrading in the private credit space right now and would personally not want to pay historically normal valuation multiples for publicly traded BDCs or even alternative asset managers that have significant exposure to direct lending, at the same time, I believe the market is overreacting in many cases. As long as you are able to buy high-quality lenders that focus on senior secured loans with low loan-to-value ratios and operate in segments of the market that are showing strength, and can do so at a significant discount to net asset value, and/or invest in well-diversified alternative asset managers that have strong balance sheets and other avenues for growth to drive overall distributable earnings per share growth, even if direct lending AUM growth remains under pressure due to weak sentiment in the near term, I think there are some very attractive buys today in this space.
In particular, I like OWL, ARES, and BX in the alternative asset management space, while in the BDC space I think there are numerous attractive opportunities, including Blue Owl’s publicly traded funds (OTF)(OBDC), Blackstone’s publicly traded BDC (BXSL), and, to a lesser extent, ARCC. As a result, while I am being prudent and remaining well diversified, I do have exposure to the BDC and alternative asset management sectors in my 7–8% yielding total return outperforming below-market-beta portfolios at High-Yield Investor.
Enjoyed this article? Sign up for our newsletter to receive regular insights and stay connected.