
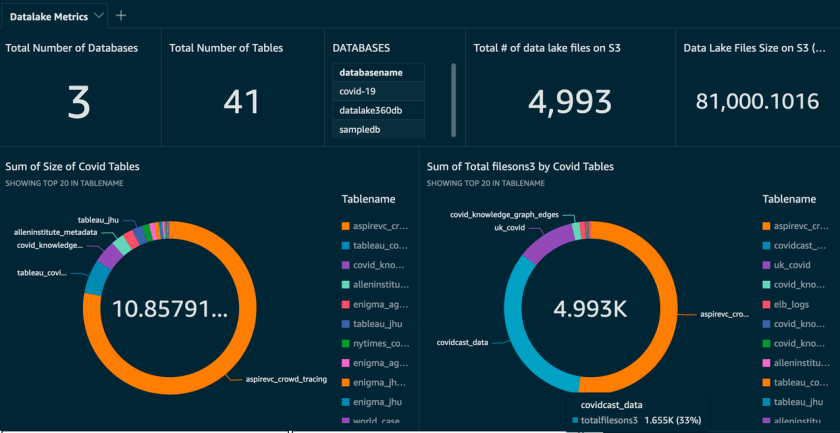
The important shift here is operational, not cosmetic: QuickSight now surfaces service health as first-class CloudWatch metrics, so teams can treat dashboards and SPICE ingestions like any other monitored workload. That matters because BI failures are no longer just reporting bugs; they become availability and performance incidents with direct user impact. The real value is the move from passive observation inside QuickSight to centralized monitoring, thresholding, and historical analysis across a 15-month window.
The mechanism is straightforward but useful. QuickSight emits counts and timings for ingestions, dashboard views, dashboard load time, visual load time, and visual load errors, plus aggregated account-level metrics. Practitioners can graph these in CloudWatch, combine them into dashboards, and trigger alarms through SNS when failures cross a static threshold. For embedded analytics teams, that means they can correlate reader traffic with latency and detect whether a slow visual or a failed refresh is the bottleneck.
The limits are just as important as the capability. These metrics tell you when something is failing or slowing down, but they do not explain root cause; overloaded databases, query complexity, or upstream data issues still need separate investigation. The feature is available only in Enterprise Edition and supported Regions, so rollout scope is not universal. Even so, the significance is clear: it makes QuickSight governance measurable, and it gives operators a practical control plane instead of relying on user complaints.
| . | Metric | Description | Unit |
| 1 | IngestionErrorCount |
The number of failed ingestions. | Count |
| 2 | IngestionInvocationCount |
The number of ingestions initiated. This includes scheduled and manual ingestions that are triggered through either the QuickSight console or through APIs. | Count |
| 3 | IngestionLatency |
The time from ingestion initiation to completion. | Second |
| 4 | IngestionRowCount |
The number of successful row ingestions. | Count |
| 5 | DashboardViewCount |
The number of times that a dashboard has been loaded or viewed. This includes all access patterns such as web, mobile, and embedded. | Count |
| 6 | DashboardViewLoadTime |
The time that it takes a dashboard to load. The time is measured starting from the navigation to the dashboard to when all visuals within the view port are rendered. | Millisecond |
| 7 | VisualLoadTime |
The time it takes for a QuickSight visual to load, including the round-trip query time from the client to QuickSight and back to the client. | Millisecond |
| 8 | VisualLoadErrorCount |
The number of times a QuickSight visual fails to complete a data load. | Count |
Access QuickSight metrics in CloudWatch
Use the following procedure to access QuickSight metrics in CloudWatch:- Sign in to the AWS account associated with your QuickSight account.
- In the upper-left corner of the AWS Console Home, choose Services, and then choose CloudWatch.

- On the CloudWatch console, under Metrics in the navigation pane, choose All metrics, and choose QuickSight.

- To access individual metrics, choose Dashboard metrics, Visual metrics, and Ingestion metrics.
- To access aggregate metrics, choose Aggregate metrics.

Visualize metrics on the CloudWatch console
You can use the CloudWatch console to visualize metric data generated from your QuickSight deployment. For more information, see Graphing metrics.Create an alarm using CloudWatch console
You can also create a CloudWatch alarm that monitors CloudWatch metrics for your QuickSight assets. CloudWatch automatically sends you a notification when the metric reaches a threshold you specify. For examples, see Using Amazon CloudWatch alarms.Use case overview
Let’s consider a fictional company, OkTank, which is an independent software vendor (ISV) in the healthcare space. They have an application that is used by different hospitals across different regions of the country to manage their revenue. OkTank has hundreds of hospitals with thousands of healthcare employees accessing their application and has embedded operations related to their business using multiple QuickSight dashboards in their application. In addition, they allow embedded authoring experience to each hospital’s in-house data analysts to build their own dashboards for their BI needs. All the dashboards are powered by a database cluster, and they have multiple ingestion schedules. Because their QuickSight usage is growing and hospitals’ in-house data analysts are contributing by bringing in more data and their own dashboards, OkTank wants to monitor and make sure they’re providing their readers with a consistent, performant, and uninterrupted experience on QuickSight. OkTank has some key monitoring needs that they deem critical:- Monitoring console – They want a general monitoring console where they can monitor reader engagement in their account, most popular dashboards, and overall visual load performance. They would like to monitor overall ingestion performance in their account.
- Dashboard adoption and performance – They want to monitor traffic growth with respect to performance to make sure they’re meeting scaling needs.
- Visual performance and availability – They have some visuals with complex queries and would like to make sure these queries are running fast enough without failures so that their readers have a performant and uninterrupted experience.
- Ingestion failures – They want to be alerted if any scheduled ingestion fails, so that they can act right away and make sure their readers don’t experience any interruptions.
Monitoring console
OkTank wants to have a general monitoring console to look at key KPIs, monitor reader engagement, and make sure their readers are getting a consistent and uninterrupted experience with QuickSight. To create a monitoring console and add a KPI metric to it, OkTank takes the following steps:- On the CloudWatch console, under Metrics in the navigation pane, choose Dashboards.
- Choose Create dashboard.

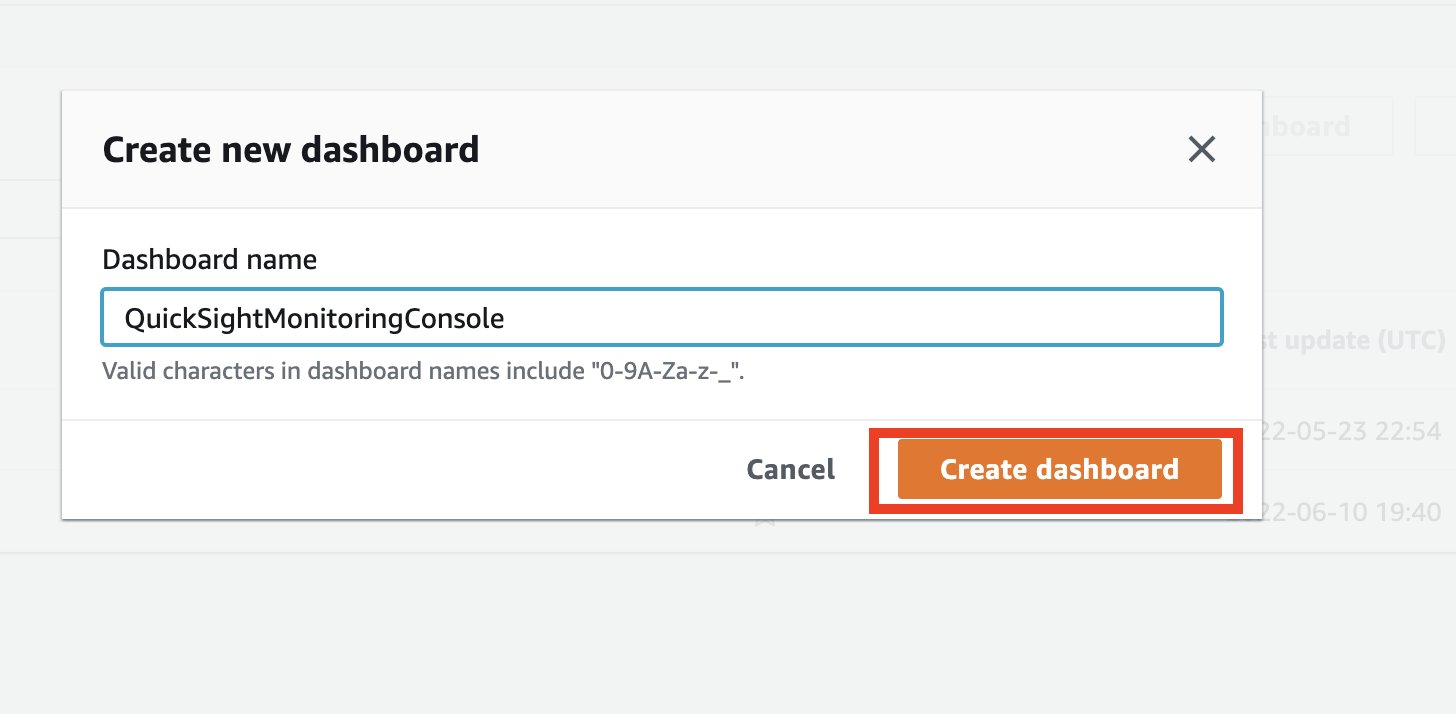
- Enter the dashboard name and choose Create dashboard.
- On the blank dashboard landing page, choose either Add a first widget or the plus sign to add a widget.

- In the Add widget section, choose Number.

- On the Browse tab, choose QuickSight.
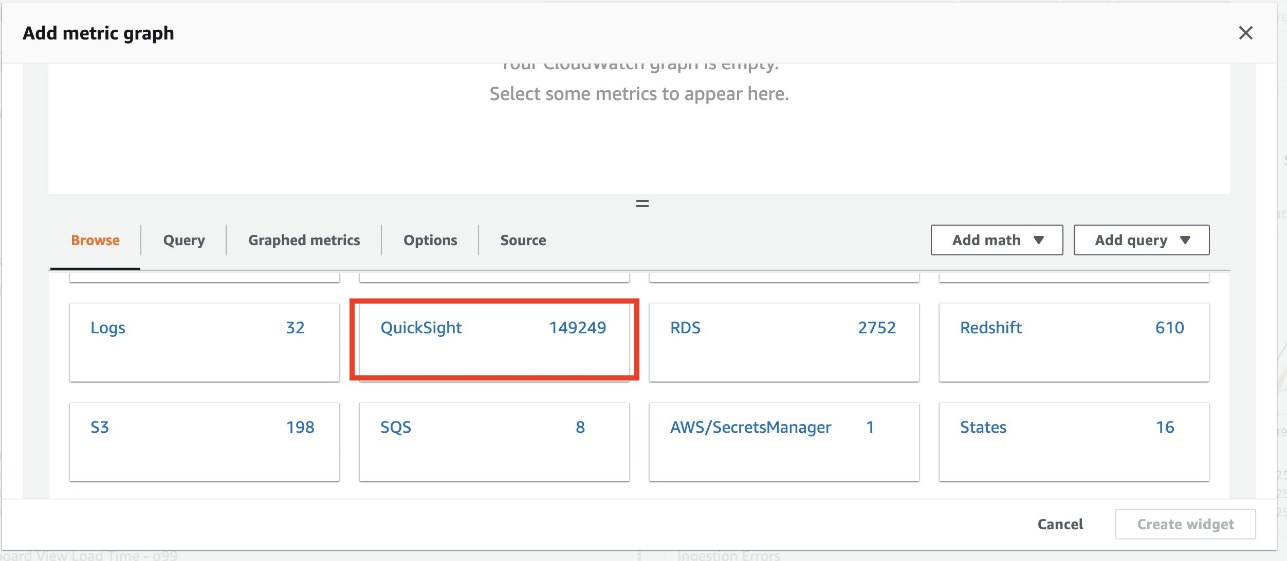
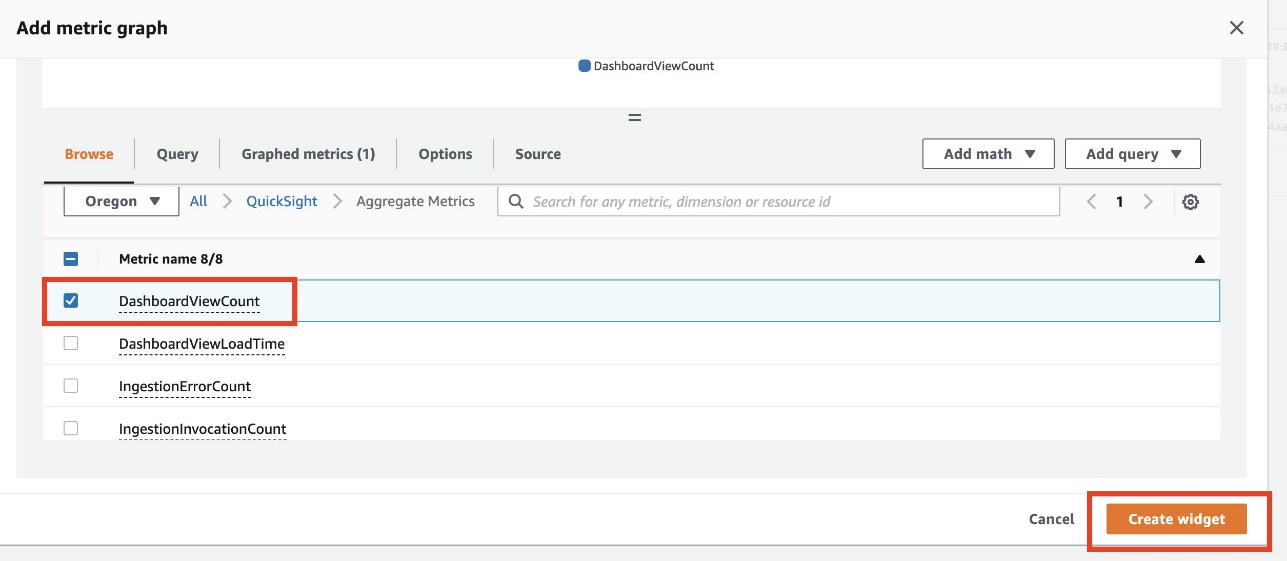
- Choose Aggregate metrics.
- Select DashboardViewCount.
- Choose Create widget.
- On the options menu of the newly created widget, choose Edit.

- Enter the desired widget name.
- For Statistic, choose Sum.
- For Period, choose 1 day.
- Choose Update widget.


Dashboard adoption and performance
OkTank has some critical dashboards, and they want to monitor adoption of that dashboard and track its loading performance to make sure they can meet scaling needs. They take the following steps to create a widget:- On the monitoring console, choose the plus sign.

- In the Add widget section, choose Line.

- In the Add to this dashboard section, choose Metrics.

- On the Browse tab, choose QuickSight.
- Choose Dashboard metrics.

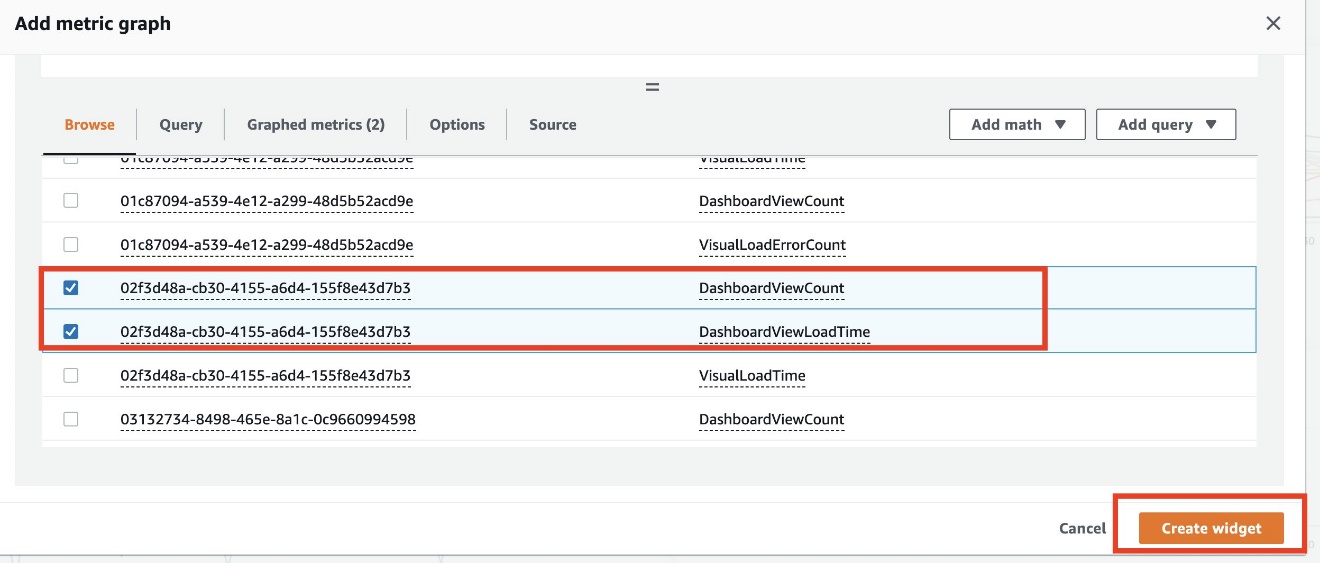
- Choose the
DashboardViewCountandDashbordViewLoadTimemetrics of the critical dashboard. - Choose Create widget.

Visual performance and availability
OkTank has some visuals that require them to run complex queries while loading. They want to provide their readers with consistent and uninterrupted experience. In addition, they would like to be alerted in case a query experiences failures when running or takes longer than the desired runtime. They take the following steps to monitor and set up an alarm:- On the monitoring console, choose the plus sign.
- In the Add widget section, choose Line.
- In the Add to this dashboard section, choose Metrics.
- On the Browse tab, choose QuickSight.
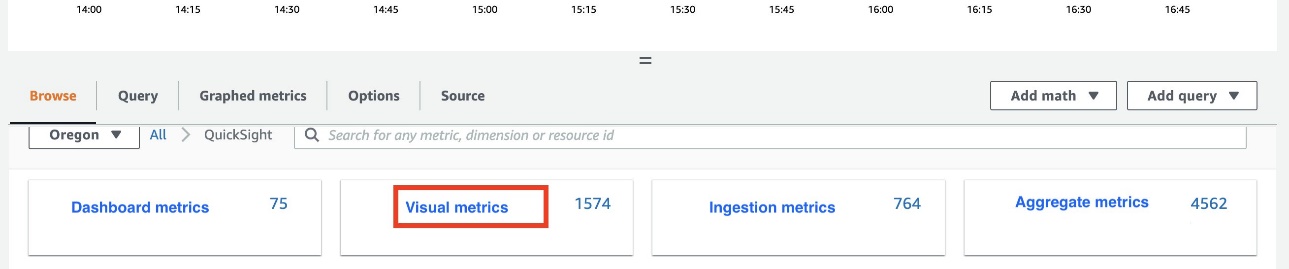
- Choose Visual metrics.
- Choose the
VisualLoadTimemetric of the critical visual and configure the time period on the menu above the chart. - To get alerted in case the critical visual fails to load due to query failure, choose the
VisualLoadErrorCountmetric. The newly created widget shows visuals load performance over the selected time frame.
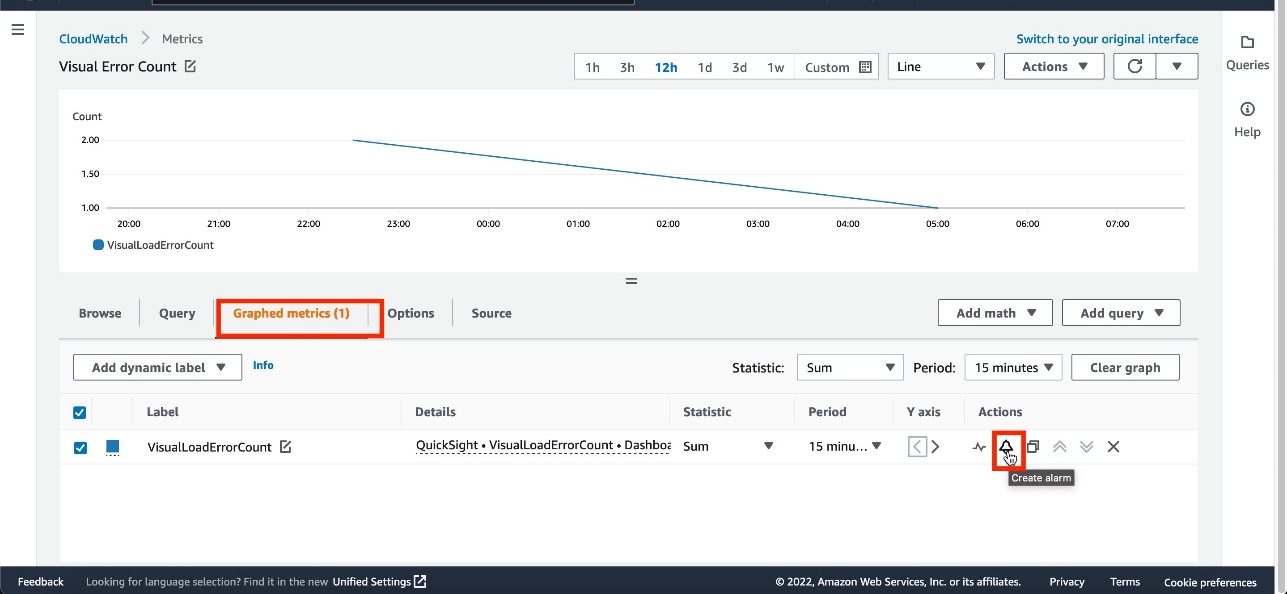
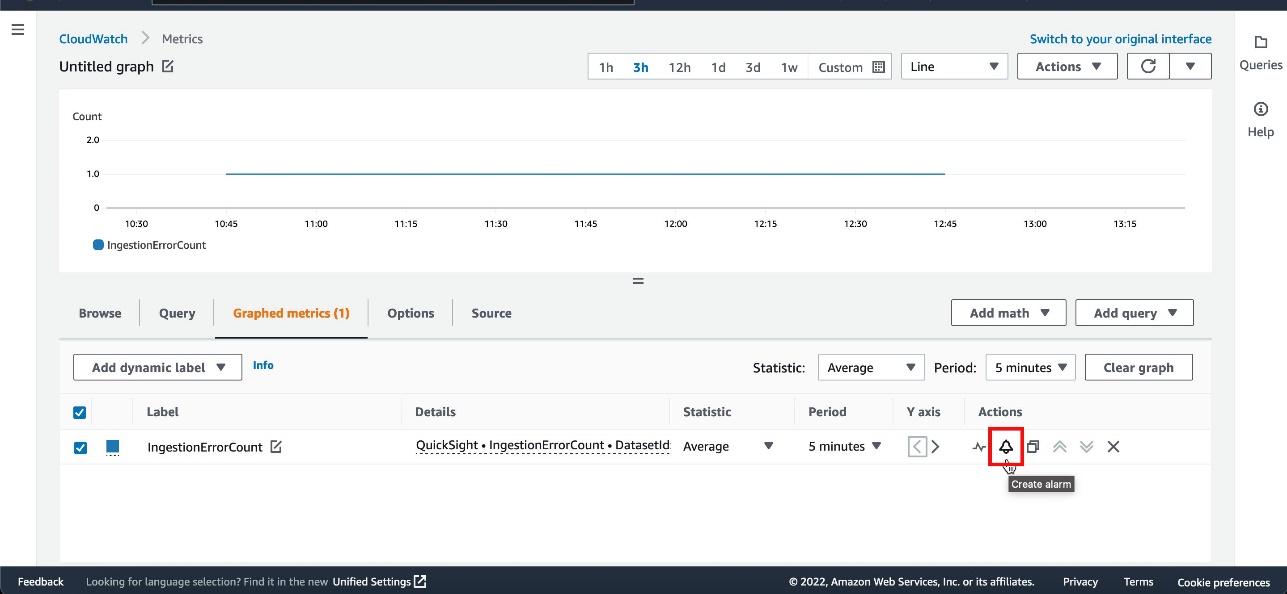
 - On the Graphed metrics tab, select the
VisualLoadErrorCountmetric. - On the Actions menu, choose Create alarm.
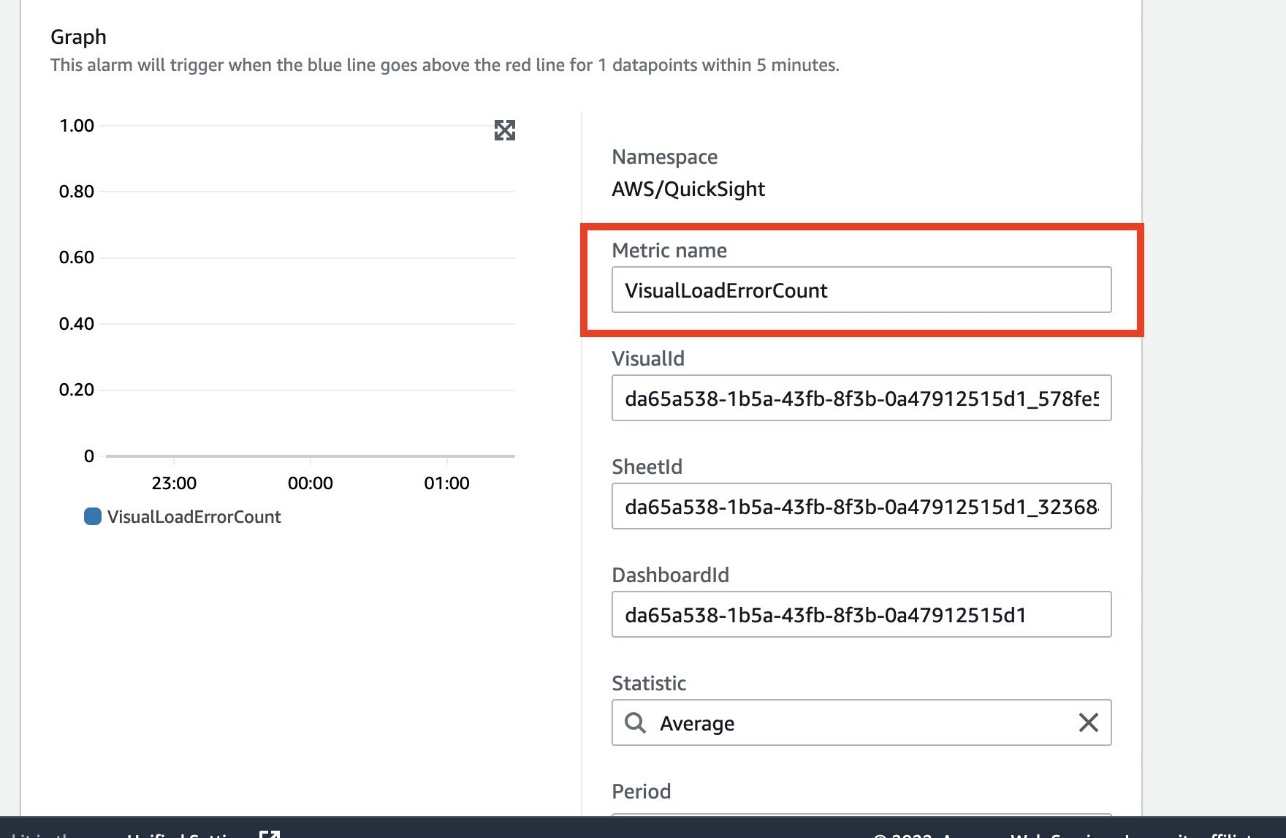
- For Metric name, enter a name.
- Confirm that the value for DashboardId matches the dashboard that has the visual.
 In the Conditions section, OkTank wants to be notified when the error count is greater than or equal to 1.
 - For Threshold type, select Static.
- Select Greater/Equal.
- Enter
1. - Choose Next.

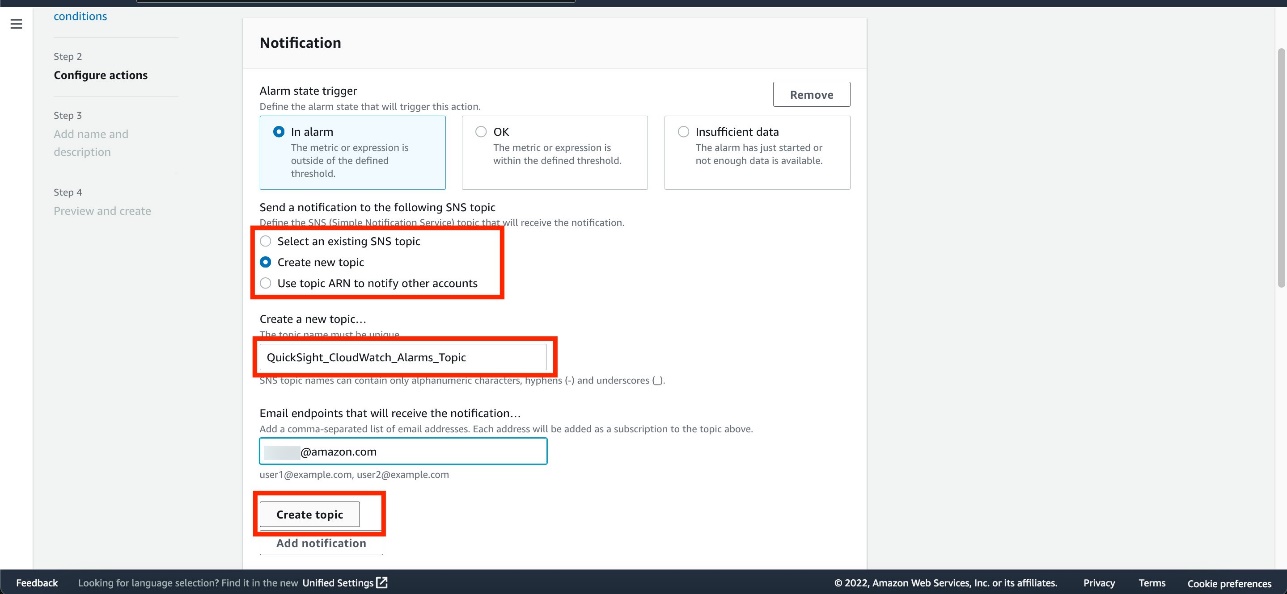
- In the Notification section, choose Select an existing SNS topic or Create a new topic.
- If you’re creating a new topic, provide a name for the topic and email addresses of recipients.
- Choose Create topic.
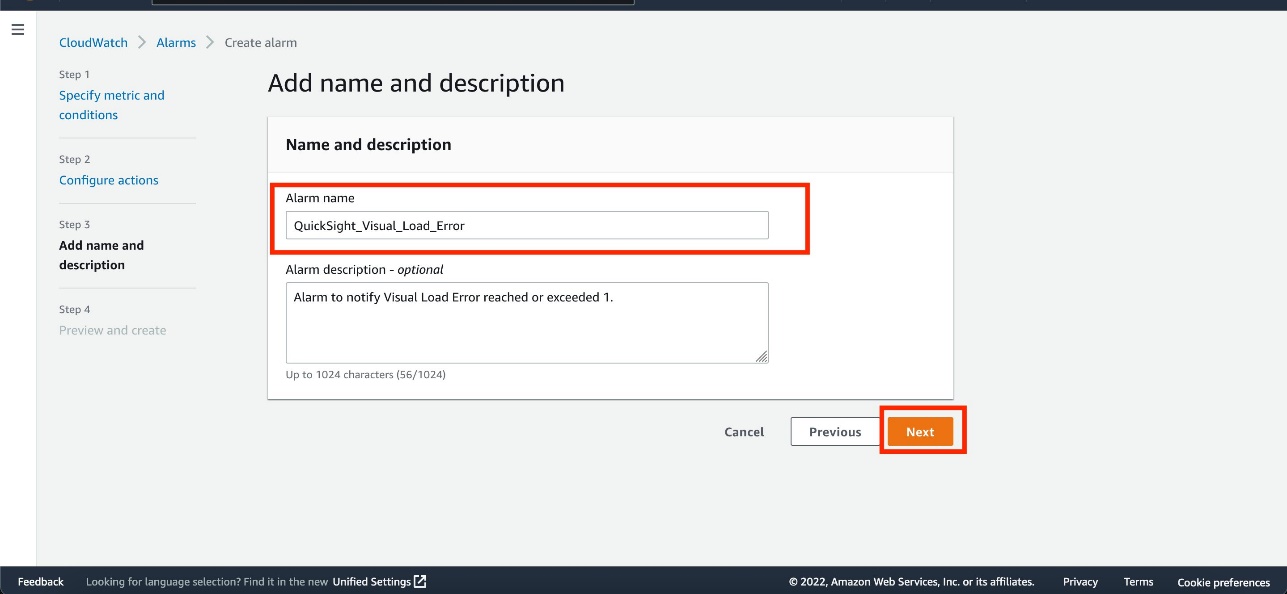
- Enter an alarm name and optional description.
- Choose Next.
- Verify the details and choose Create alarm.

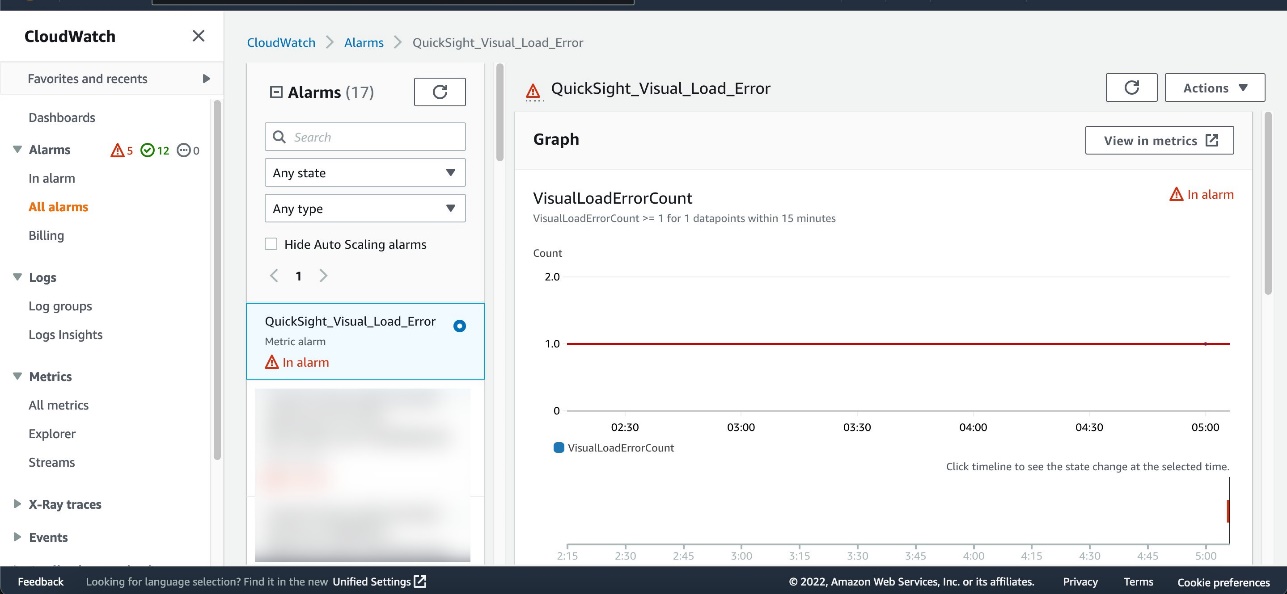
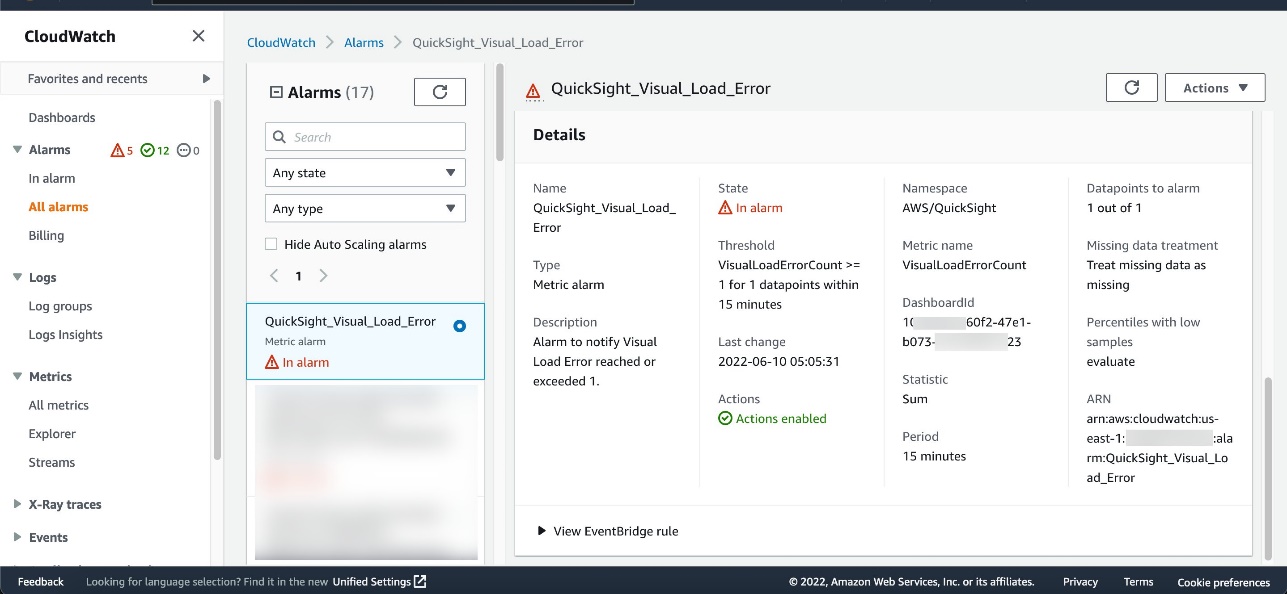
VisualLoadErrorCount value becomes 1 or more (depending on the number of times the dashboard is invoked) and the alarm state is set to In alarm.


Ingestion failures
OkTank wants to be alerted if any scheduled SPICE data ingestion fails, so that they can act right away and make sure their readers don’t experience any interruptions. This allows the administrator to find out the root cause of the SPICE ingestion failure (for example, an overloaded database instance) and fix it to ensure the latest data is available in the dependent dashboards. They take the following steps to monitor and set up an alarm:- On the monitoring console, choose the plus sign.
- In the Add widget section, choose Line.
- In the Add to this dashboard section, choose Metrics.
- On the Browse tab, choose QuickSight.
- Choose Ingestion metrics.

- Choose the
IngestionErrorCountmetric of the dataset and configure the time period on the menu above the chart.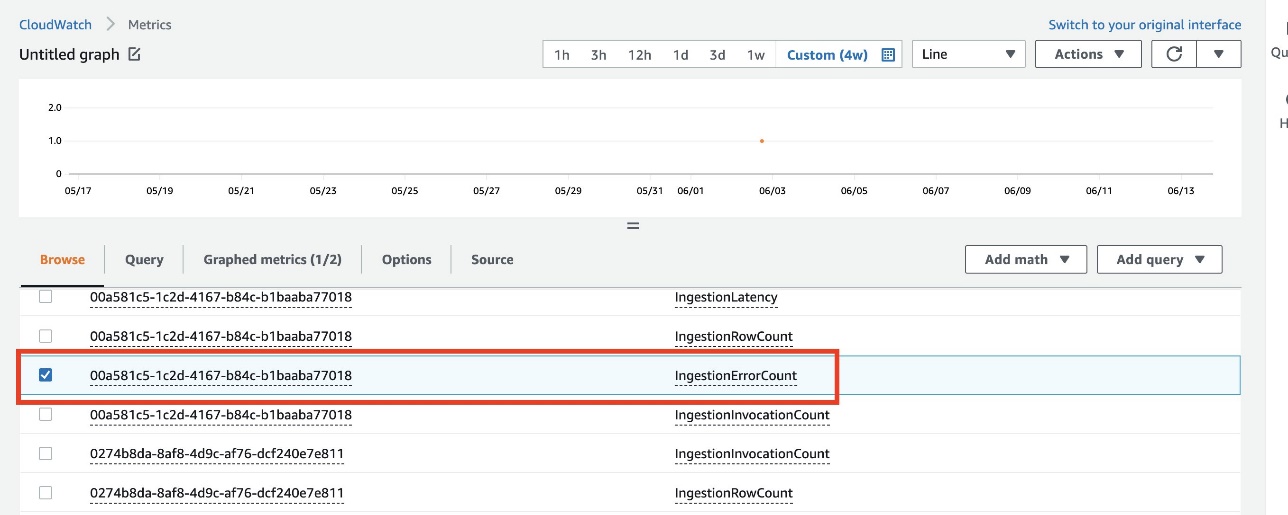
- Follow the same steps as in the previous section to set up an alarm.
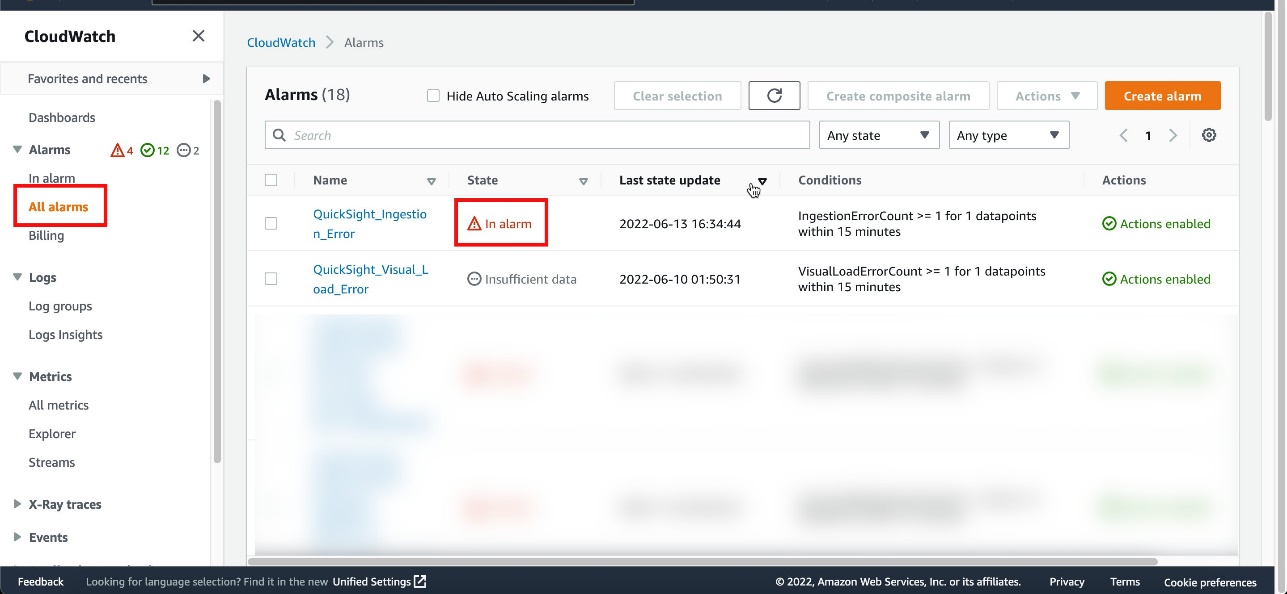
In Alarm state and you receive an email notification.

Conclusion
With QuickSight metrics in CloudWatch, QuickSight developers and administrators can observe and respond to the availability and performance of their QuickSight ecosystem in near-real time. They can monitor dataset ingestions, dashboards, and visuals to provide end-users of QuickSight and applications that embed QuickSight dashboards with a consistent, performant, and uninterrupted experience. Try out QuickSight metrics in Amazon CloudWatch to monitor your Amazon QuickSight deployments, and share your feedback and questions in the comments.About the Authors
Mayank Agarwal is a product manager for Amazon QuickSight, AWS’ cloud-native, fully managed BI service. He focuses on account administration, governance and developer experience. He started his career as an embedded software engineer developing handheld devices. Prior to QuickSight he was leading engineering teams at Credence ID, developing custom mobile embedded device and web solutions using AWS services that make biometric enrollment and identification fast, intuitive, and cost-effective for Government sector, healthcare and transaction security applications. Raj Jayaraman is a Senior Specialist Solutions Architect for Amazon QuickSight. Raj focuses on helping customers develop sample dashboards, embed analytics and adopt BI design patterns and best practices.Enjoyed this article? Sign up for our newsletter to receive regular insights and stay connected.