
iShares MSCI Saudi Arabia ETF (NYSEARCA:KSA) is an exchange-traded fund that provides exposure to the Saudi Arabian stock market. While the Saudi equity market is not nearly as developed as the United States, KSA had 87 holdings as of January 6, 2022, with the portfolio balanced in accord with its benchmark, the MSCI Saudi Arabia IMI 25/50 Index.
The 25/50 methodology of its index, the performance of which KSA seeks to replicate, means that no single issuer should represent more than 25% of the fund, while the sum of all 5% fund weightings should not exceed 50% in total. Still, the fund is quite concentrated, with the top 10 holdings representing over 60% of the portfolio.
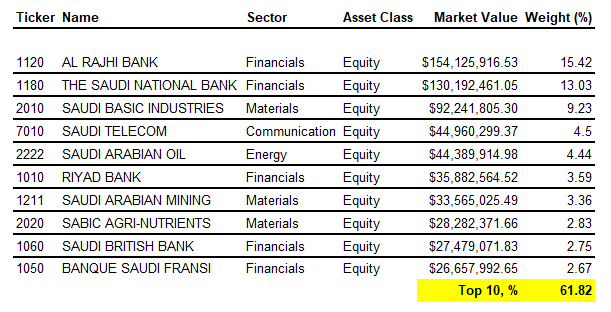
(Data provided by iShares)
Saudi Arabia is well known for its oil exports (e.g. Saudi Aramco (ARMCO), which itself in the top 10, albeit with only a 4.44% weighting as of recent). However, KSA is in fact largely exposed to the domestic Financials sector.
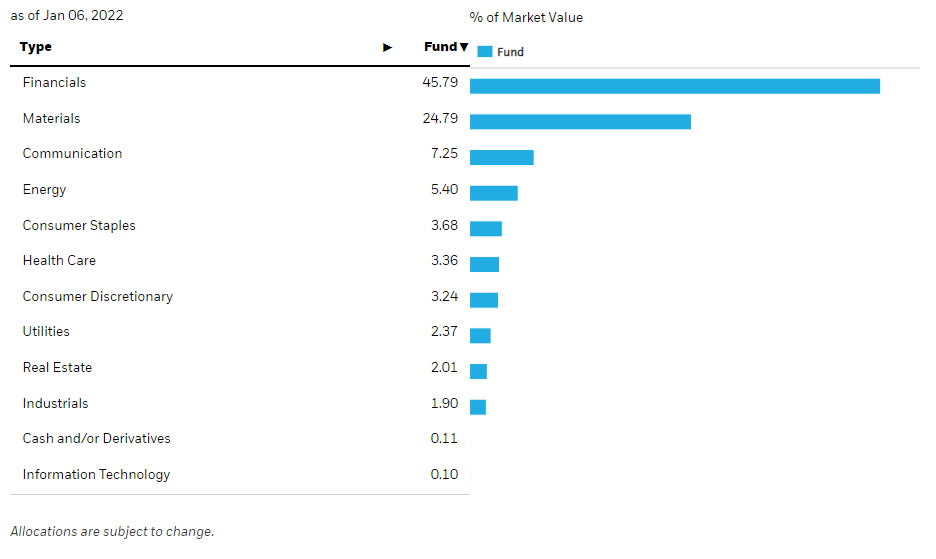
(iShares)
So, while you might think that buying KSA is a clear, indirect bet on oil prices, you are actually buying largely into the domestic Saudi Financials sector. Of course, the performance of that sector itself is likely to be affected by the wider Saudi economy which will be affected by oil prices.
According to Statista:
In 2020, the oil sector in Saudi Arabia generated an estimated gross domestic product of approximately 607.7 billion Saudi riyals. The total estimated GDP for that year was about 2.62 trillion Saudi riyals.
So, the oil sector represented about 23% of 2020 GDP. My chart below illustrates the positive correlation between the price of KSA shares (illustrated by weekly candlesticks) and crude oil futures prices (the red line).
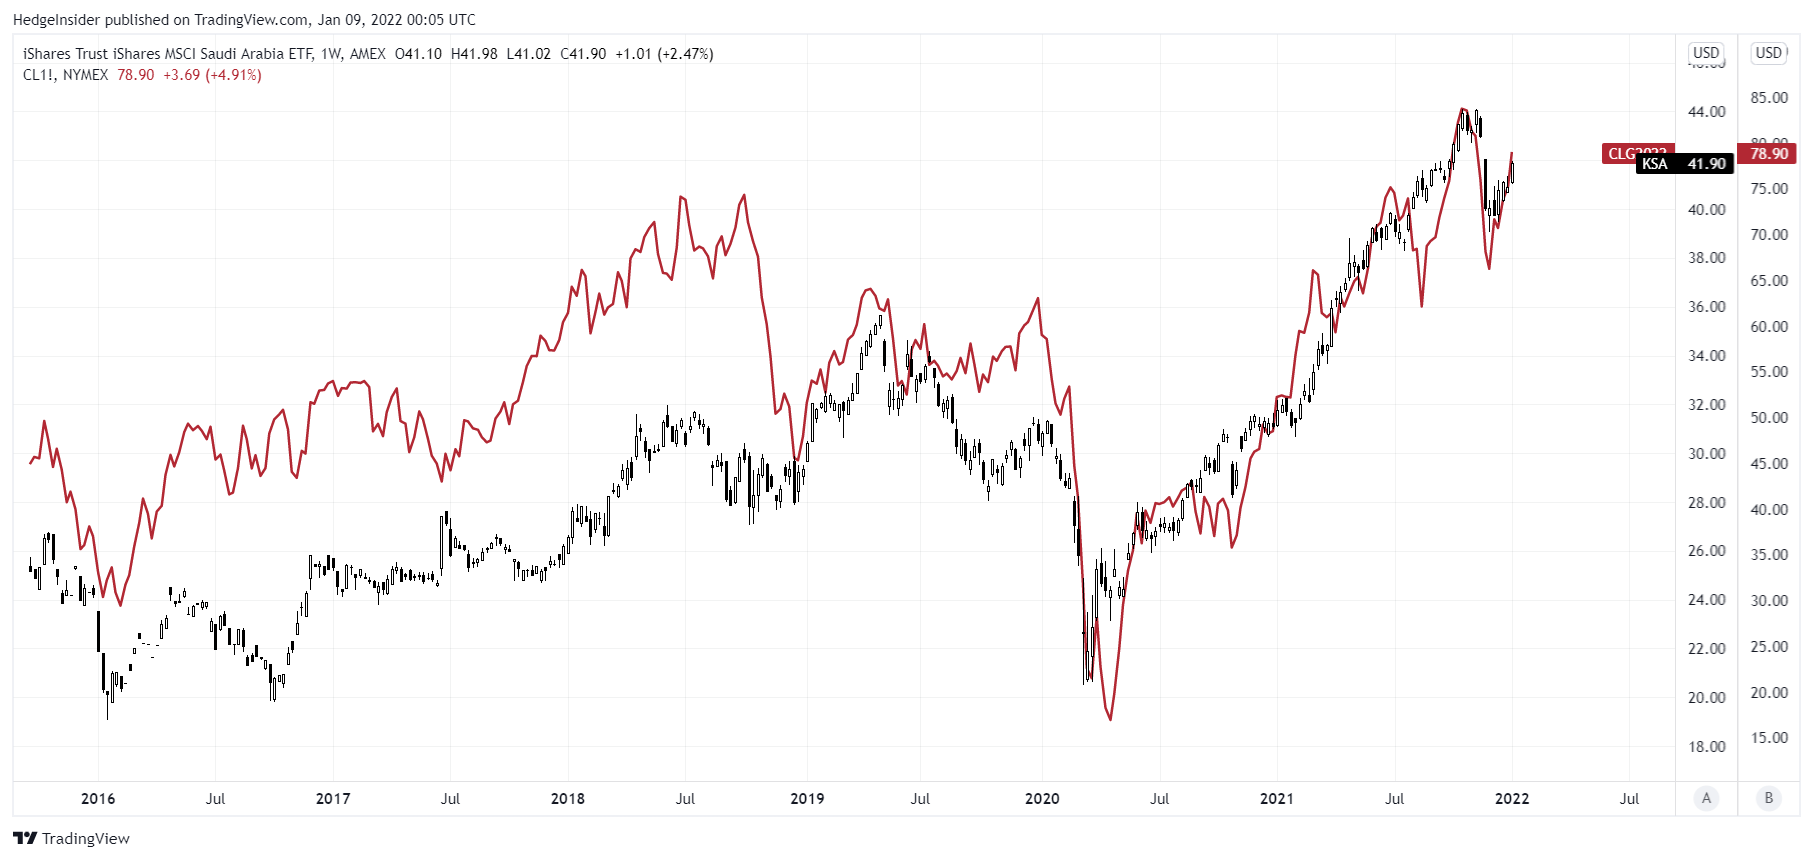
(TradingView)
The correlation is strong most recently, and has been reasonably strong in the past too. Still, both KSA shares and crude oil prices are naturally exposed to the international strength of the U.S. dollar, and both equities and oil prices tend to be classed as “risk-on” assets; we’d expect a positive correlation based on that factor alone. So, I don’t think oil prices are “everything” for KSA, but certainly an important component of KSA’s market value.
Therefore, it is difficult to “value” KSA, as earnings expectations are going to be based in part on the future of oil prices, and commodity prices are very difficult to predict. Nevertheless, I can start with consensus analyst estimates for a forward three- to five-year period, with data provided by Morningstar. The expected average earnings growth rate is currently 19.10%. That is in contrast to Saudi CPI (inflation) of close to zero most recently, although over a 10-year horizon the average CPI rate is about 1%.
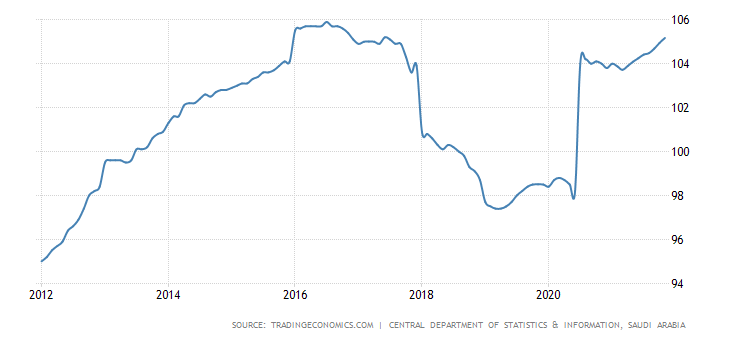
(Trading Economics. The chart illustrates Saudi Arabia’s CPI index, which is quite volatile.)
So, earnings growth is projected to be strong. How do we discount those earnings? Bond yield data for Saudi Arabia is mostly scarce, the country was able to raise $1.25 billion of “30-year conventional bonds” in November 2021 (Bloomberg) at a yield of 3.36%. That reflected a spread on that day of issuance (November 9, 2021) of about 1.54% over the U.S. 30-year bond yield of approximately 1.82%. I would prefer to use a 10-year yield as a reference risk-free rate for equities. So, to be conservative I am going to assume a 2% spread over the current U.S. 10-year yield of 1.76%; i.e., 3.76% as a starting point.
Professor Damodaran offers an estimated 4.90% mature market equity risk premium, and a country risk premium for Saudi Arabia of 0.70%. So, adding 4.90%, 0.70%, and our notional 10-year yield for Saudi of 3.76%, we reach an estimated cost of equity of 9.36%.
The most recent factsheet for KSA’s benchmark index also offers a trailing price/earnings ratio of 21.94x, a forward price/earnings ratio of 17.58x (i.e., a forward earnings yield of 5.69%; or more recently 5.55% as KSA shares are up slightly since December 31), and a price/book ratio of 2.40x (as of December 2021 month-end). The implied return on equity is 13.65% on a forward basis.
Using all of the above information, I have built a short-term valuation gauge to assess KSA’s market value.
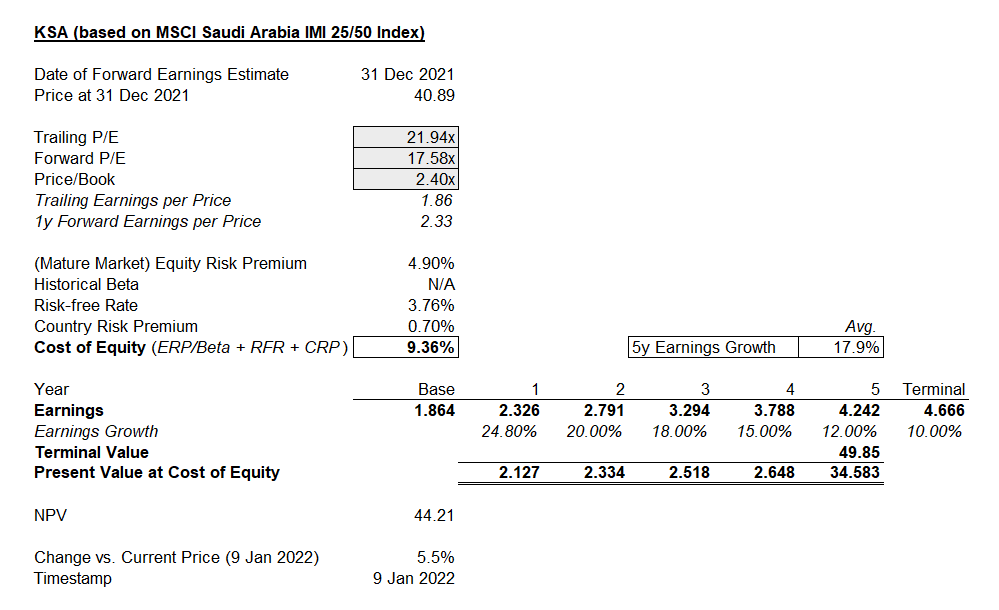
(Author’s Calculations)
Potential upside of some 5% is on offer, but I am under-stating earnings growth potentially, based on the consensus. I thought that earnings growth rates of circa 20% would probably be difficult to achieve over the full 5-6 years in question here, so I presumed a gradual decline after year one to 10% (in the terminal year). If we moved the 10-year yield up toward 5%, and kept everything else the same, we would arrive at potential downside of -8%. But neither -8% nor 5% are significant deviations, and so I would say my model is probably generating the conclusion that KSA shares are trading at fair value.
Of course, all of this probably does hinge on strong oil prices. Still, one leading factor I like to look at is the credit impulse, and bank credit to the private non-financial sector in Saudi Arabia has been very strong recently. According to the BIS, bank credit flow scaled from 61.9% in Q2 2020 (i.e., expressed as a percentage of GDP) to 71.5% in Q2 2021. That move beats most other countries (for example, the U.S. bank credit impulse went negative over the same time horizon). So, this could mean that KSA’s Financials exposures will particularly do well over the next 6-12 months (the credit impulse can be viewed as a leading indicator).
With bank credit flowing, profits at banks and other financial stocks should do well. And if oil prices continue to remain firm, KSA should be able to justify its value. Further, the implied cost of equity is already almost 10%. So, it is possible that KSA offers annual returns in the region of 10%. According to the Big Mac Index (a rough PPP model for assessing FX fair values), the Saudi riyal currency is also roughly at fair value on a GDP-per-capita adjusted basis (about 3.5% undervalued). But more importantly, the riyal is pegged to the USD, so there is no material FX risk in buying KSA shares. It is still nice to know that the riyal is probably not overvalued though.
In summary, I think KSA could be justified within a broader equity portfolio. However, due to the volatility of oil prices, I would perhaps be cautious. I would also note that top importers of Saudi exports include China and the United States, and both countries are “ahead” in their business cycles. A (continued) growth slowdown in these countries, not to mention oil price volatility, could generate some adverse earnings growth surprises in Saudi Arabia.

(Fidelity)
The chart above illustrates, based on Fidelity’s business cycle research (last updated for Q4 2021), that the U.S. is in the latter half of its mid-cycle phase, and China is already likely entering a recessionary phase. This could be negative for oil prices; China is the second-largest consumer of oil after the United States. So, while KSA might fit within a wider portfolio, I would take a cautious approach, and I am personally neutral. That is, on the basis that KSA is likely trading at close to fair value and carries some significant underlying risk, notwithstanding the strong domestic bank credit impulse.
Enjoyed this article? Sign up for our newsletter to receive regular insights and stay connected.