
VYM: Buy For The High Yield, But Consider These 3 Complementary ETFs Too
Vanguard VYM ETF: High Yield, But Consider These ETFs Too (NYSEARCA:VYM)
Summary
- VYM has been a solid performer lately, outperforming the S&P 500 by 12% YTD. With a 3% yield and 0.06% fee, it’s a great addition to any dividend ETF portfolio.
- Fundamentally, VYM is sound. It trades at 15.33x forward earnings with a 0.88 five-year beta. As long as the market favors these factors, it should continue to perform well.
- These are reasons why VYM qualified for my newly-created Active Equity ETF Portfolio. However, it’s not perfect. It lacks the growth factor and needs some help from other funds.
- I’ll highlight three other cheap ETFs that complement VYM well. All are high-quality, have low expense ratios, and improve diversification by holding enough different stocks from different industries than VYM.
- Looking for a portfolio of ideas like this one? Members of Hoya Capital Income Builder get exclusive access to our model portfolio. Learn More »
Investment Thesis
The Vanguard High Dividend Yield ETF (NYSEARCA:VYM) is a staple in many investors’ dividend portfolios, and a quick look at its dividend yield and expense ratio explains why. VYM pays 3.14% on a trailing-twelve-month basis and charges just 0.06% annually in fees, tying it for the cheapest dividend ETF on the market today. While I look for more than just cheap fees and high assets under management, keeping your expenses low is never a bad idea, especially when searching for a long-term core holding.
VYM has outperformed the SPDR S&P 500 ETF (SPY) by 12% YTD primarily for two reasons: its low five-year beta (0.89) and low forward price-earnings ratio (15.10). These are undoubtedly great features of the economy heading towards a possible recession. However, they’re insufficient on their own, and why I believe an integrated approach using multiple ETFs and strategies is necessary. Therefore, today’s article will focus on how VYM complements other low-cost ETFs like USMC, SCHD, and DIA. All three are components of my newly-released ‘Active Equity ETF Portfolio,’ and I hope to demonstrate how you can use VYM as part of a balanced approach to ETF investing.
ETF Overview
Strategy
VYM tracks a custom Index derived from the FTSE Global Equity Index Series. While the proprietary strategy isn’t public, we know that nearly all the U.S. investable equity universe is eligible except for REITs, LLPs, LPs, MLPs, LLCs, and BDCs. Large-cap equities are selected based on their forecasted dividend yields, and the Index rebalances annually while focusing on keeping portfolio turnover low. For me, that’s key for the passive investor. You don’t want to wake up one morning and find out your portfolio has substantially changed.
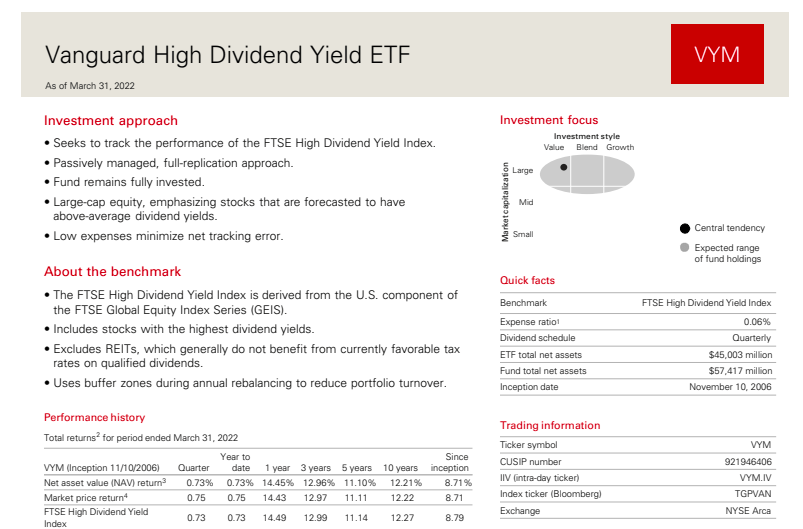
VYM launched on November 10, 2006, and currently yields 3.14% with a 6.76% five-year annualized dividend growth rate. It holds over 400 securities, has a 0.06% expense ratio, pays quarterly dividends, and has $37.25 billion in assets under management.
Sector Exposures and Top Holdings
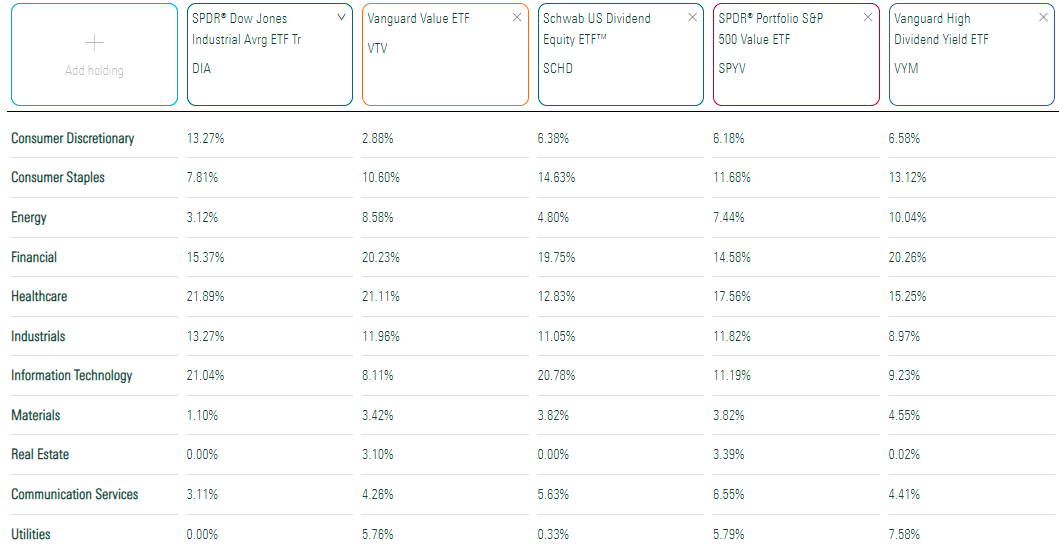
VYM’s sector exposures are below, courtesy of Morningstar. You can see that it’s overweight Consumer Staples, Energy, and Financials relative to DIA. VYM also has relatively high exposure to Utilities stocks, which tend to work great in recessionary periods. I wrote a bullish article in March on the Utilities Select Sector SPDR ETF (XLU), and it’s squeaked out a 2.08% return compared to a 13.29% loss for the S&P 500 Index since.
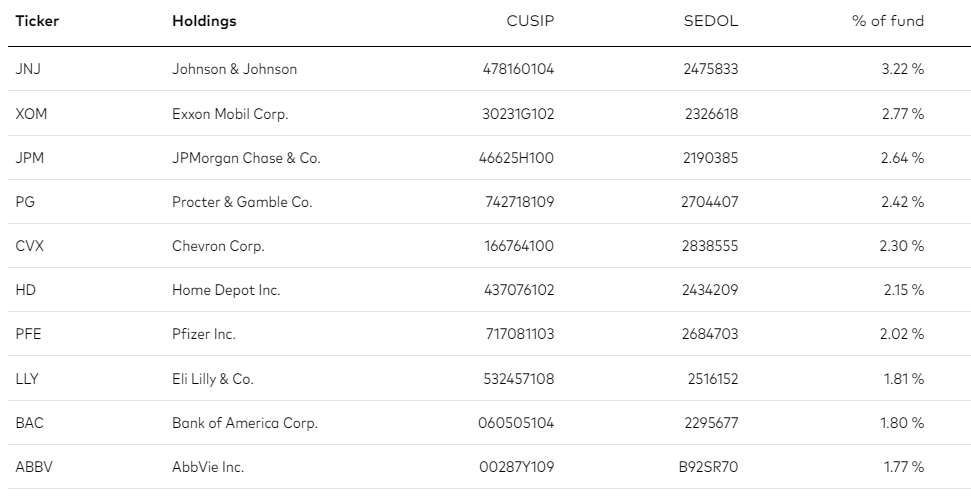
VYM’s top ten holdings are shown below, totaling 22.90%. All are household names, including Johnson & Johnson (JNJ), Exxon Mobil (XOM), and JPMorgan Chase (JPM). JPMorgan was in the news recently after scoring poorly on the Federal Reserve’s annual stress test, meaning they have ‘less capacity to increase dividend or stock repurchase plans.’ VYM’s 6.76% five-year dividend growth rate is already somewhat low compared to peers like SCHD, and this is one weakness I recommend dividend investors address by holding other complementary funds.
Performance History
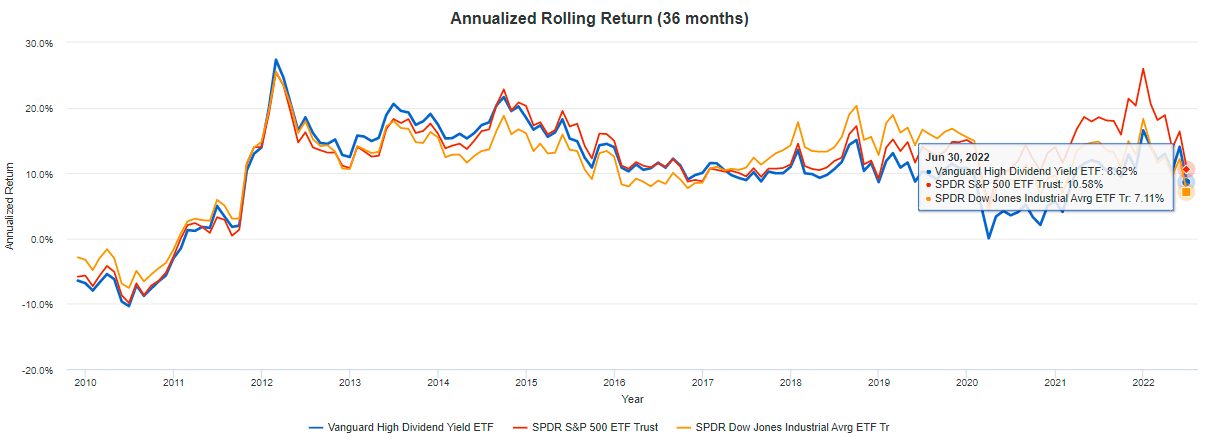
Since its launch in October 2006, VYM has trailed most broad-market indices, including the S&P 500 and the Dow Jones Industrial Average. Here, we see that VYM has gained an annualized 7.90% return, which is 0.81% and 0.74% less than SPY and DIA, respectively.
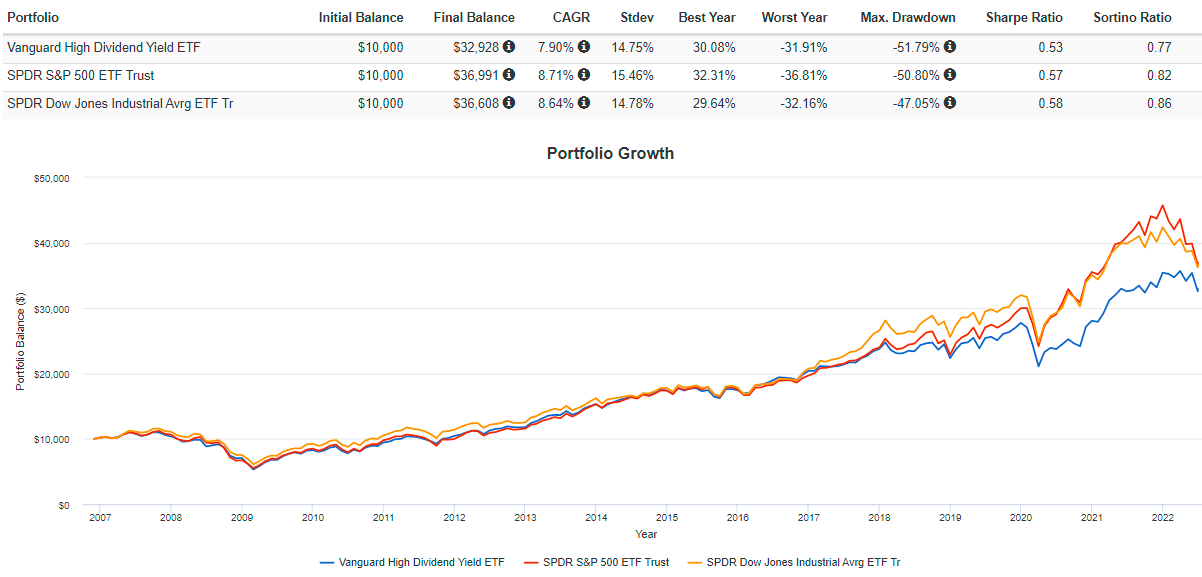
However, SPY only began to pull ahead about five years ago. The rolling three-year returns chart indicates that most times prior to 2017, VYM was the better fund to own. Rarely will either ETF significantly outperform the others for long, and we’re seeing now that when that happens, the reversal can be swift.
Fundamental Analysis
Dividends
VYM currently yields 3.11% and has an extremely low 11% annual turnover rate. As mentioned, low turnover is excellent for passive investors since it means they can ‘look away’ for longer without having to reassess the portfolio. However, it also means the highest-yielding stocks are rotated into the ETF less frequently, resulting in a lower yield. ETFs that rebalance quarterly and have fewer holdings, like the iShares Core High Dividend ETF (HDV), will always have a higher yield than VYM because that’s in the strategy. In contrast, VYM seeks to hold only securities with above-average yields, so it’s a less aggressive approach to dividend investing. Still, for a pure equity ETF, I think anything above 3% is pretty good.
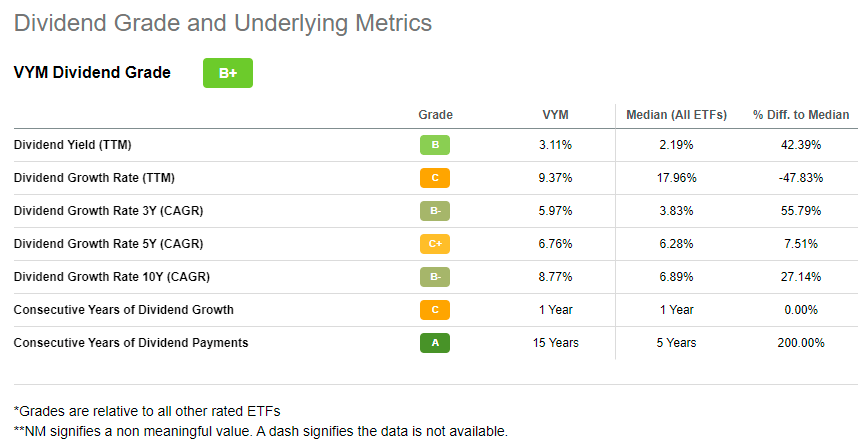
Seeking Alpha’s Dividend Grades work pretty well for low-turnover ETFs like VYM, and it currently has an overall rating of B+. The consistency rating is strong simply because it’s a well-established ETF, but the dividend growth ratings aren’t impressive.
Current Dividend Metrics
Here are some industry-level dividend metrics for VYM’s top 20 industries, which total nearly 70% of the ETF. You can see that the weighted-average forward dividend yield of 3.16% is almost the same as the ETF’s trailing 3.11% yield, but the annualized five-year growth rate of 10.25% is above what the fund has experienced over the same period. It’s good news, but still, it’s behind what other ETFs like SCHD offer.
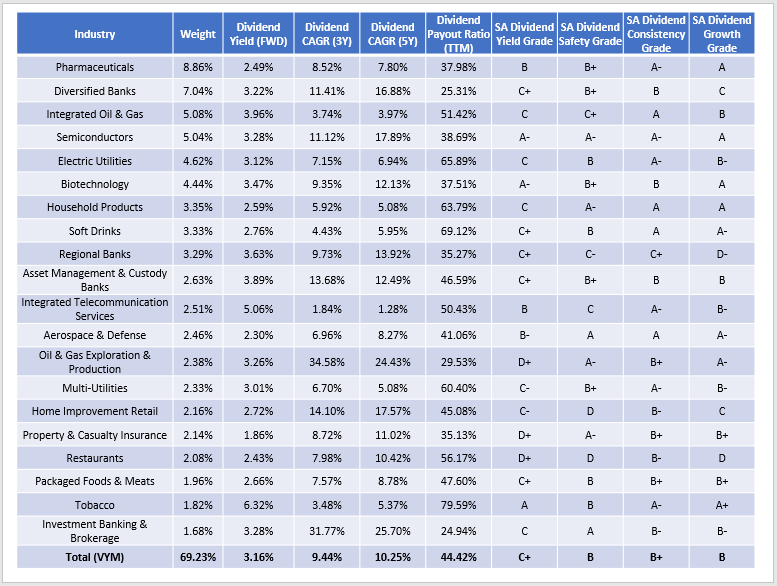
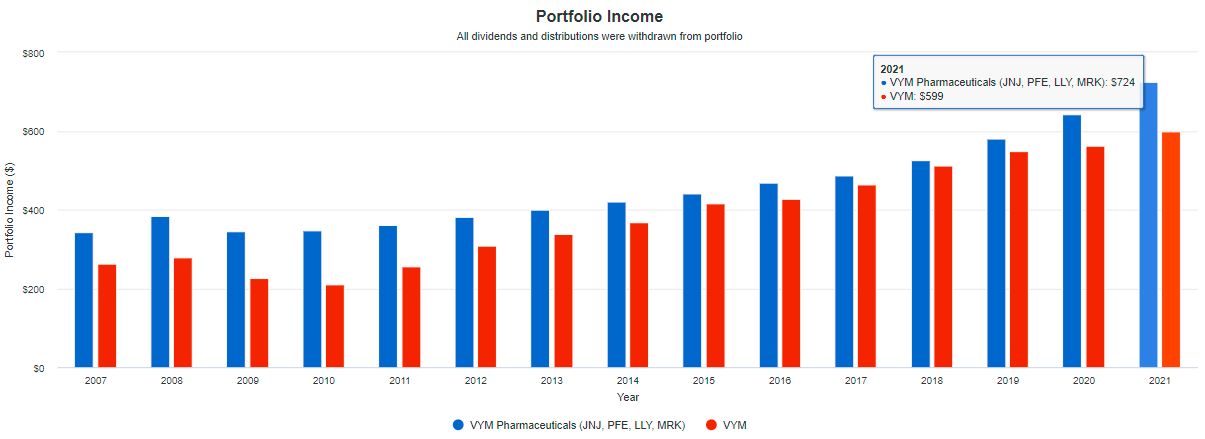
On the plus side, the low weighted-average 44.42% payout ratio means companies aren’t being stretched thin. I believe current dividends are well-supported and can probably withstand a recession. Furthermore, VYM’s weighted-average Dividend Consistency Grade of B+ is the strongest of the four Seeking Alpha measures. The ETF is bolstered by Pharmaceuticals stocks like Johnson & Johnson, Pfizer (PFE), Eli Lilly (LLY), and Merck & Co. (MRK), whose dividend consistency and growth are a net positive for the fund. Over the last 15 years, a hypothetical equal-weight portfolio, rebalanced annually without reinvesting dividends, would generate a 7.24% yield compared to 5.99% for VYM. It’s that type of growth dividend investors need more with inflation running so high.
VYM Growth, Valuation, and Profitability Metrics
Next, I want to discuss how well VYM scores on other non-dividend-related metrics, such as revenue and earnings per share growth, valuation, and profitability. The following table summarizes several key metrics for VYM’s top 20 industries and compares them with the SPDR S&P 500 ETF (SPY).
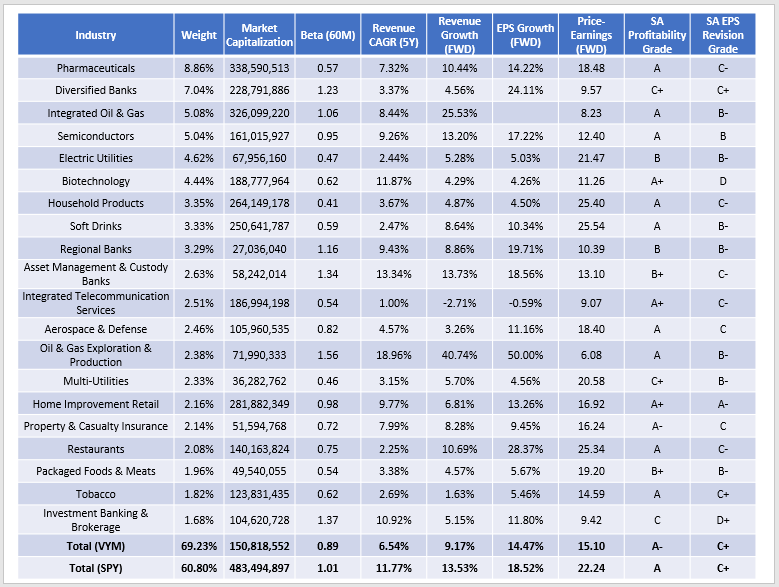
At this high level, we can draw the following conclusions:
1. VYM is slightly less diversified than SPY as measured by its concentration in its top 20 industries (69.23% vs. 60.80%). This may surprise investors since SPY’s top ten holdings account for 28% of its total. However, simply avoiding too much mega-cap exposure doesn’t ensure better diversification. A balance should occur at the sector and industry level, and VYM could use some help from other complementary ETFs (discussed shortly).
2. VYM’s five-year beta of 0.89 is one reason it’s outperformed SPY this year. A lower beta indicates outperformance in a downturn, but the reverse is also true. To illustrate, in 2008, VYM beat SPY by 5% but trailed by 9% in 2009. Investors may want to increase their portfolio’s beta after substantial market declines, depending on risk tolerance. Calling a bottom is tough, but hopefully, we’re close.
3. VYM has about 4-5% lower revenue and earnings per share growth than SPY. Market participants haven’t cared much about growth this year, which is why they’ve been fleeing to low P/E defensive dividend ETFs like VYM. The 15.10x forward earnings valuation is seven points less than SPY, but recall it was 12 points in late December. It’s clear that high P/E stocks were targeted this year, but value investing isn’t as attractive today as it once was. I feel there’s a case for shooting for a higher growth rate.
4. VYM’s weighted-average Seeking Alpha Profitability Grade of “A-” is only slightly behind SPY and not a cause for concern. The same is true for its SA EPS Revision Grade, which I use to measure market sentiment. Worth mentioning is that since December, VYM’s EPS Revision Grade declined from “B-” to “C+,” while SPY’s has stayed constant at “C+.” Again, I feel this is justification for increasing exposure to growth stocks.
Complementary ETFs
So what ETFs complement VYM well? Judging by the earlier table, the following industries are holding VYM back from a growth perspective:
- Electric Utilities
- Biotechnology
- Household Products
All have single-digit forward revenue and earnings per share growth rates plus ultra-low five-year betas. It stands to reason that ETFs without much exposure to these industries are good complements. I found three worth checking out, which I’ll briefly discuss next.
Principal U.S. Mega-Cap Multi-Factor Index ETF (USMC)
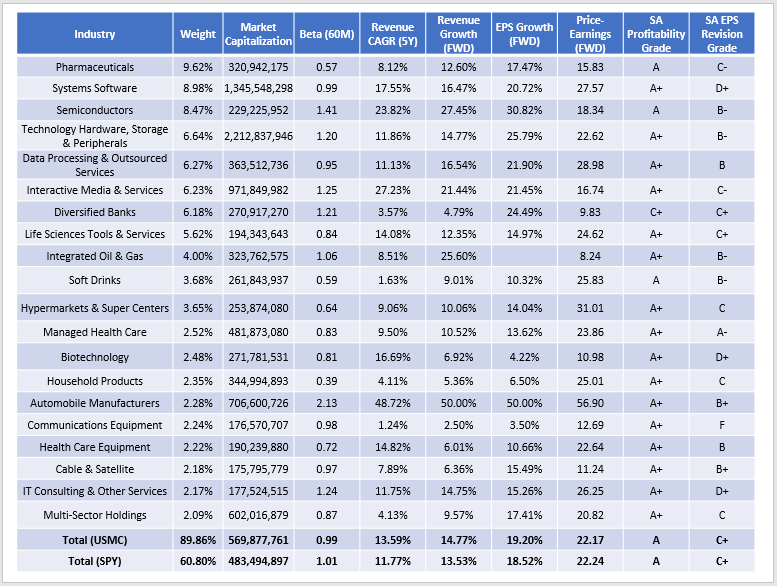
I touched on this relatively unknown mega-cap ETF in April, which has outperformed SPY by almost 5% since. However, USMC’s Index reconstituted, and its five-year beta has increased substantially from 0.87 to 0.99. Now, USMC holds only one Biotechnology stock (ABBV) and one Household Products stock (PG), with no Electric Utilities exposure. USMC earns an impressive “A” Seeking Alpha Profitability Grade, just like SPY, and has a nearly 20% forward EPS growth rate. Essentially, it now functions as an S&P 500 alternative. On its own, it’s probably not diversified enough. However, I think it fits nicely if used as part of a broader ETF strategy.
Schwab U.S. Dividend Equity ETF (SCHD)
Long-time readers of mine will know I’m partial to SCHD, but I’ve also criticized it from time to time. Still, it’s a top-notch fund that wisely uses four key quality metrics to select 100 U.S. equities each year in March:
- free cash flow to total debt
- return on equity
- indicated dividend yield
- five-year dividend growth
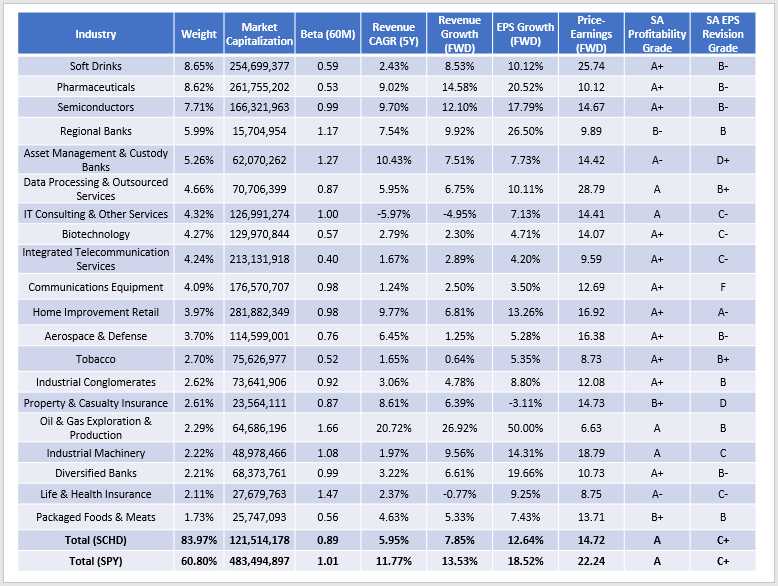
SCHD’s total exposure to Electric Utilities, Biotechnology, and Household Products is just 6.22%. While it doesn’t score great on growth, it has a cheap forward P/E and excellent dividend yield and dividend growth to compensate. Interested readers can check out my latest review of SCHD Original Post>
SPDR Dow Jones Industrial Average ETF (DIA)
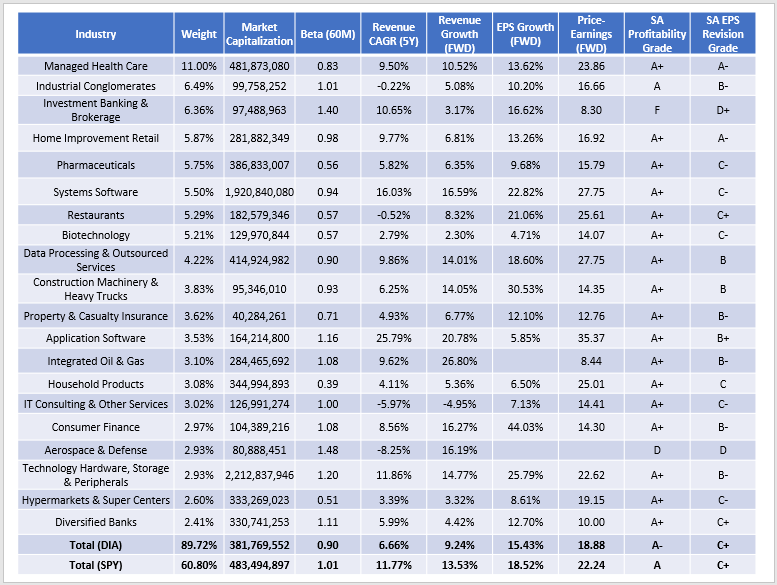
The Dow Jones Industrial Average is one of the most widely-used barometers for U.S. blue-chip stocks (except transportation and utilities). That last exception helps in the search for a complement to VYM, and it’s also nice that DIA still trades at less than 20x forward earnings with a 15.43% forward EPS growth rate. That’s a bit higher than VYM, but the total exposure to the three industries is only 8.18%.
Investment Recommendation
VYM satisfies at least three factors likely to be relevant as we advance:
- A relatively high forward dividend yield (3.16%)
- A low five-year beta (0.88)
- A low valuation (15.10x forward earnings)
It also scores pretty well on profitability, but it’s only the 24th best out of 65 dividend ETFs I track on that metric. In my view, VYM’s most significant headwind is a lack of growth. Industries like Electric Utilities, Biotechnology, and Household Products limit VYM’s potential in a bull market despite being excellent defensive holdings in a bear market.
Dividend investors looking for a complementary ETF to VYM should consider USMC to boost the portfolio’s overall profitability and quality, SCHD for superior dividend growth, and DIA for stronger revenue and earnings per share growth. In all cases, valuations seem reasonable to me, and diversification would improve. All four ETFs are also part of my newly-released Active Equity ETF Portfolio on the Hoya Capital Income Builder Marketplace that I hope you’ll check out. And, as always, if you have any questions or are interested in learning how well other ETFs complement VYM, please feel free to comment below. Thank you for reading.
Enjoyed this article? Sign up for our newsletter to receive regular insights and stay connected.