
S&P U.S. Indices H1 2023: Analyzing Relative Returns To Russell

For ETF investors, the key takeaway is not simply that one index outperformed another in a given half-year, but why the gap emerged. When two benchmarks cover broadly similar U.S. equity universes, small differences in constituent selection can create meaningful tracking divergence. That matters most for investors using index funds as building blocks for asset allocation, because the benchmark design itself can change the return profile they are actually buying.
Sector tilts were especially important in large-cap and style portfolios. In a market led by a narrow set of technology-heavy names, indexes with higher Information Technology exposure had a structural tailwind, while less exposed peers lagged. For ETF readers, this is a reminder that “growth” and “value” are not abstract labels; they often embed sector and factor exposures that can shift after periodic reconstitution. Those shifts can alter relative performance even when the fund’s mandate looks unchanged.
Further down the cap spectrum, stock selection and size effects become harder to dismiss. Mid- and small-cap benchmarks can diverge because inclusion rules, rebalancing practices and constituent screens produce different portfolios, not merely different weightings of the same stocks. That makes index methodology a core due-diligence item for long-term investors comparing ETFs: the question is not only which index is cheaper or more popular, but which construction rules best fit the role the fund is meant to play in a diversified portfolio.
Olivier Le Moal
By Fei Wang
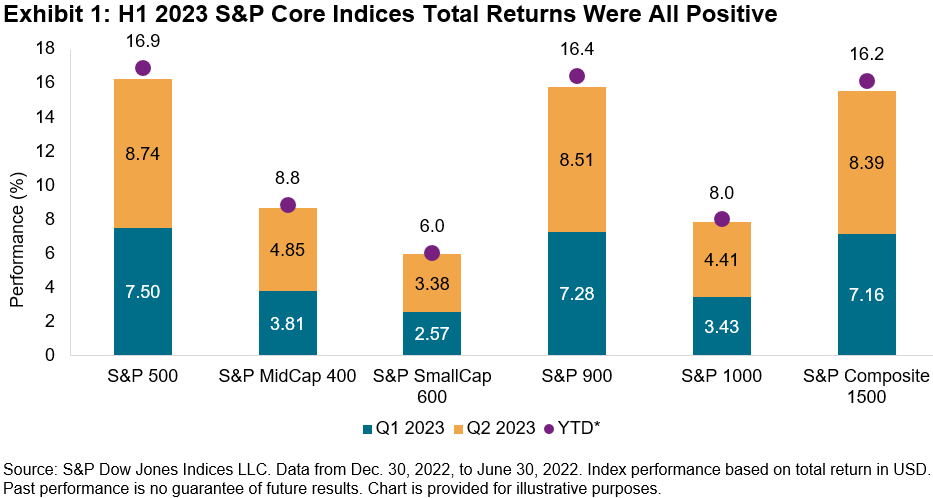
After a challenging year in 2022, the U.S. equity market saw a strong turnaround in the first half of 2023, with the S&P 500® up 17% since year-end 2022.
Exhibit 1 shows that the rebound was also observed across the cap spectrum. Returns in the second quarter outperformed the first quarter after the market shook off regional bank concerns earlier this year.
The S&P Core Indices generally underperformed their Russell counterparts in H1 2023. The large- and small-cap indices, in particular, saw relatively large differences.
For instance, the S&P 500 underperformed the Russell Top 200 by 2.53% in H1 2023, its second largest H1 underperformance since 1995, only 2020 was larger (-2.59%).
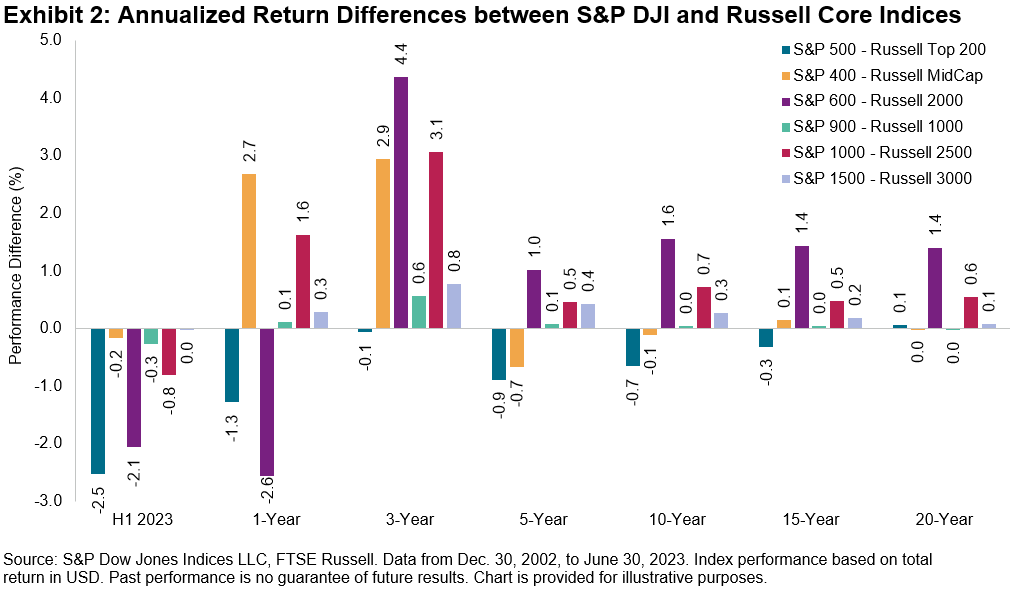
The S&P 500’s underperformance appears to have been largely driven by having less exposure to Information Technology, which has been running hot so far this year.
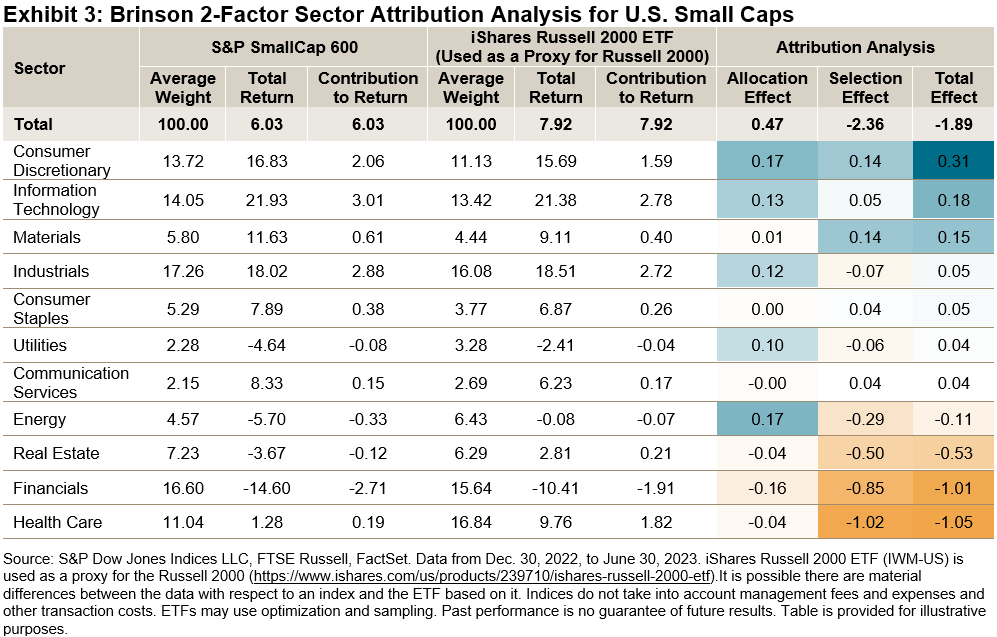
But there were other possible considerations further down the cap spectrum. For example, the S&P SmallCap 600®’s H1 2023 underperformance may have been driven by the choice of constituents – particularly in Health Care and Financials – rather than differences in sector exposures (see Exhibit 3).
The different drivers of relative performance across the cap spectrum have once again demonstrated the importance of index construction and potential impact of stock selection and size exposures.
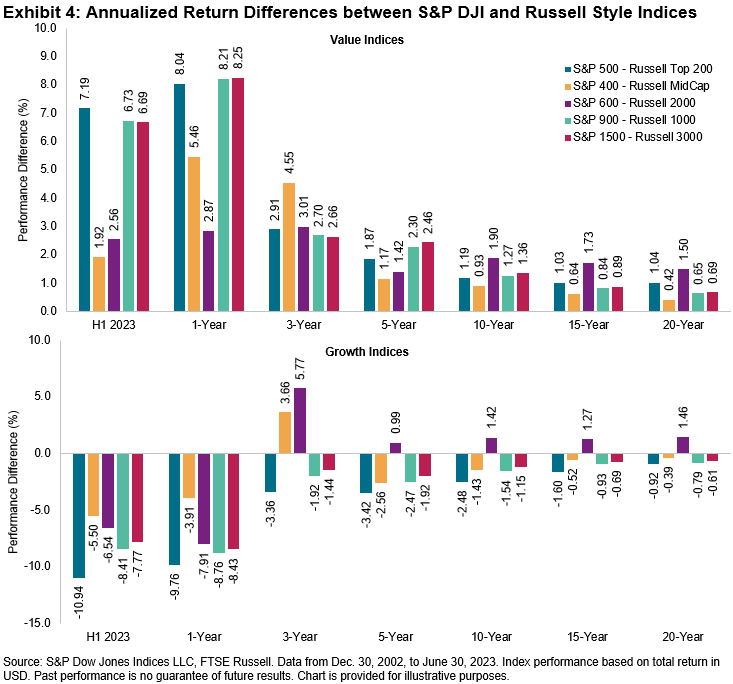
There was also elevated divergence among style indices in H1 2023. The S&P Value Indices outperformed their Russell counterparts across the cap spectrum, while the S&P Growth Indices underperformed.
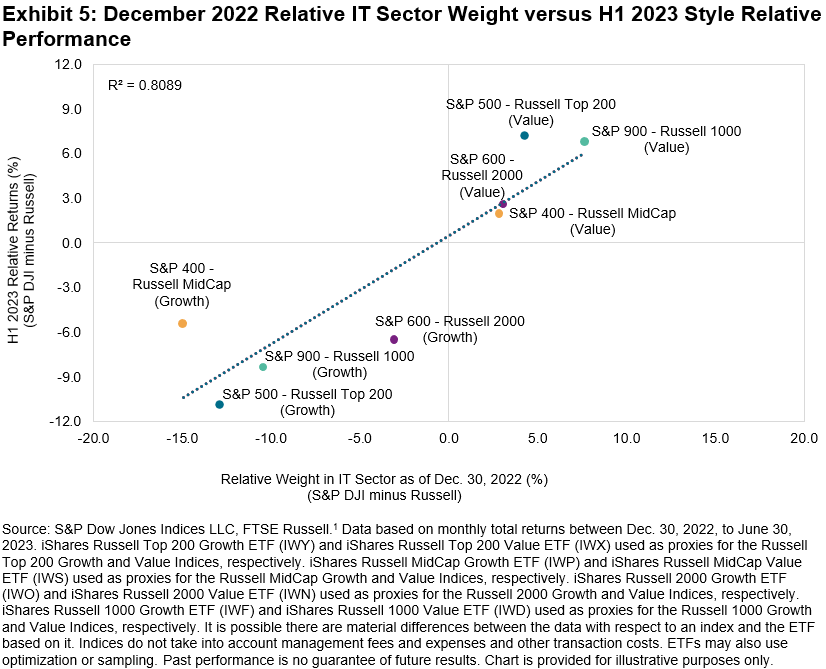
Notably, the S&P 500 Style Indices posted the largest H1 performance differentials compared to Russell counterparts since 1995 – the S&P 500 Value outperformed the Russell Top 200 Value by 7.2%, while the S&P 500 Growth underperformed by 10.9%.
Relative exposure to Information Technology helped to explain the relative performance between S&P DJI and Russell Style Indices. Indeed, Exhibit 5 shows that style indices with higher exposure to the Information Technology sector outperformed in H1 2023.
This was particularly the case given that S&P DJI’s December 2022 style reconstitution led to some sector shifts: S&P 500 Value (Growth) had more (less) exposure to Information Technology sectors than its Russell counterpart. Various Russell index-based ETFs are used as proxies for the Russell indices below.
The first half of 2023 saw a recovery among U.S. equities. Information Technology exposure was important in explaining the relative performance of the S&P 500 and S&P Style Indices compared to their Russell counterparts.
But stock selection and the size factor also played a role in mid- and small-cap indices. Once again, such performance differences highlight the importance and potential impact of index construction.
1 We used the following ETFs as proxies for the Russell indices: iShares Russell Top 200 Growth ETF, iShares Russell Top 200 Value ETF, iShares Russell MidCap Growth ETF, iShares Russell MidCap Value ETF, iShares Russell 2000 Growth ETF, iShares Russell 2000 Value ETF, iShares Russell 1000 Growth ETF and iShares Russell 10000 Value ETF.
Disclosure: Copyright © 2023 S&P Dow Jones Indices LLC, a division of S&P Global. All rights reserved. This material is reproduced with the prior written consent of S&P DJI. For more information on S&P DJI, please visit S&P Dow Jones Indices. For full terms of use and disclosures, please visit Terms of Use.
Editor’s Note: The summary bullets for this article were chosen by Seeking Alpha editors.
Enjoyed this article? Sign up for our newsletter to receive regular insights and stay connected.