The Dry Bulk 2026 Outlook (published on Value Investor’s Edge on November 6, 2025, and made public on Seeking Alpha on November 12) proclaimed this segment as a top pick for 2026, specifically the Capesize vessel class. Star Bulk (SBLK) was given as my personal pick and, as of February 11, 2026, is up 32.1% since that report was first published.
This aligned with J Mintzmyer’s personal top pick for 2026: CMB.TECH (CMBT), a more diversified shipping company but with significant Capesize exposure.
A November 19, 2025, public report entitled “Buy CMB.TECH: Shipping Poised To Outperform Into 2026” outlined the bull case for this particular stock. As of February 11, 2026, that pick is up 27.1% since publication.
Recently several VIE members have requested an update, likely in an effort to gauge market conditions during typical seasonal weakness and determine the potential for ongoing outperformance through the end of the year.
Current Market
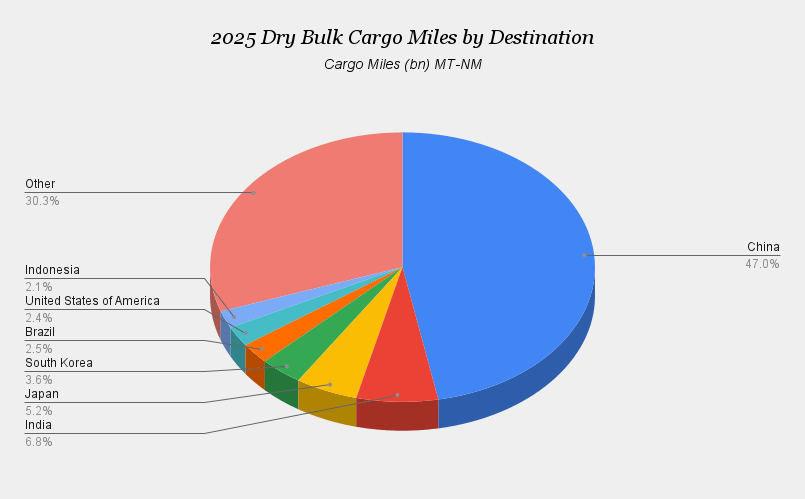
Because the Chinese New Year curbs industrial and manufacturing production in that nation, and since China composes approximately 47% of total cargo mile demand for bulkers, January and February typically mark the low point in dry bulk rates.
Dry Bulk Cargo Miles by Destination (VIE)
Source: Value Investor’s Edge
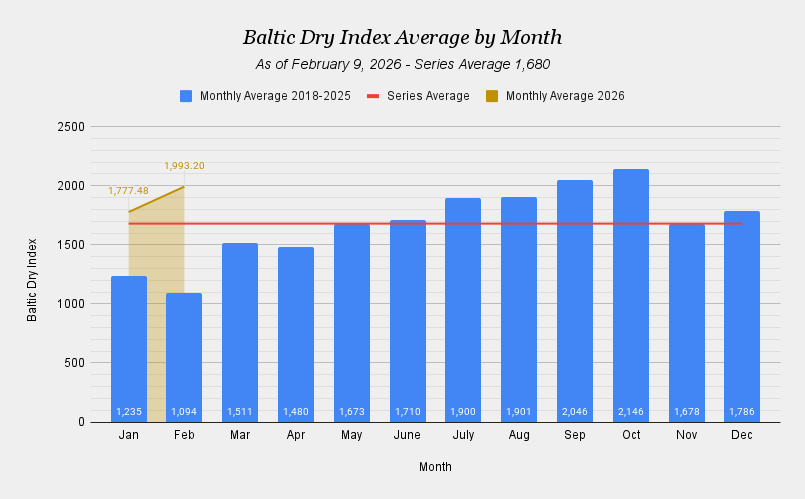
However, this January witnessed the highest reading of the Baltic Dry Index since 2010, with February, which is historically the worst month, showing even greater strength.
Baltic Dry Index Average by Month (VIE)
Source: Value Investor’s Edge
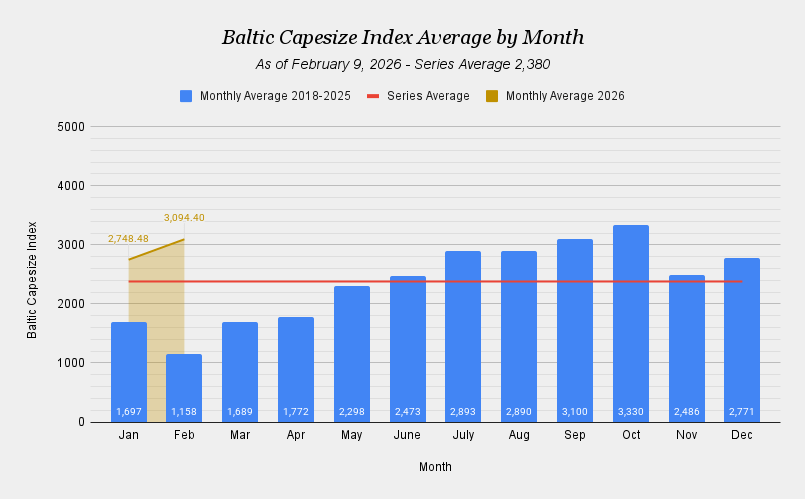
This same pattern is being observed in the Baltic Capesize Index, though recent levels are significantly more pronounced compared to 2018-2025 historical averages, suggesting acute strength.
Baltic Capesize Index Average by Month (VIE)
Source: Value Investor’s Edge
This development is significant for good reason: From a historical standpoint, if rates remain elevated during this period, it typically signals a structural shift in supply-demand balance, often pointing to a bullish outlook for the remainder of the year. The magnitude of this deviation further suggests that 2026 could be the strongest year for the sector in over 15 years.
So, what’s behind this move, and is it sustainable?
The Capesize Market & China
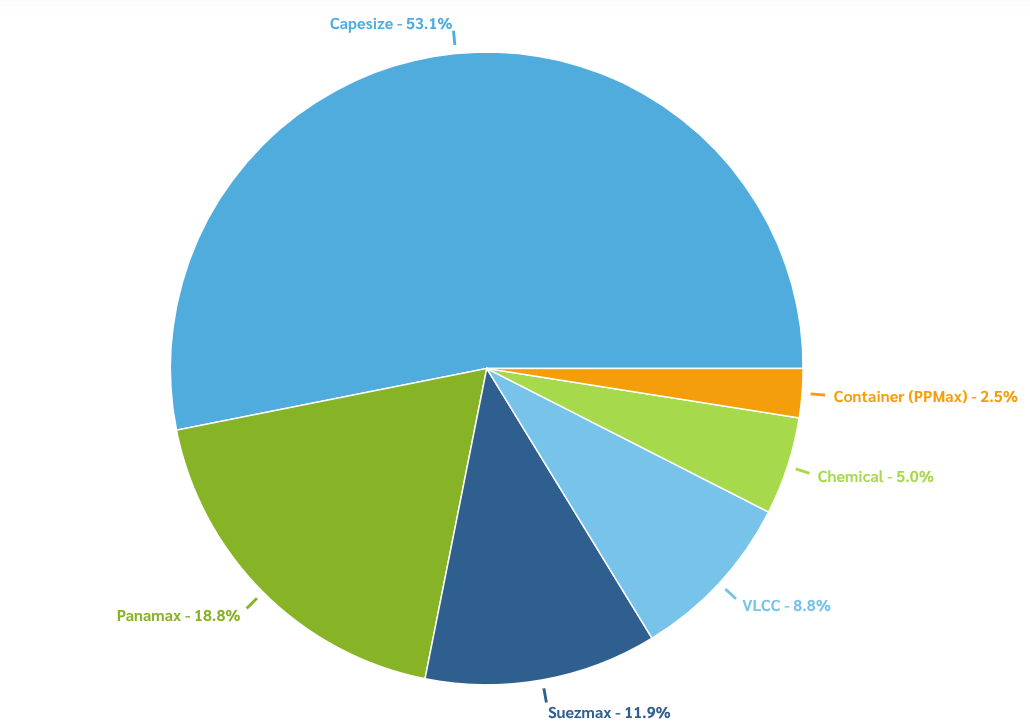
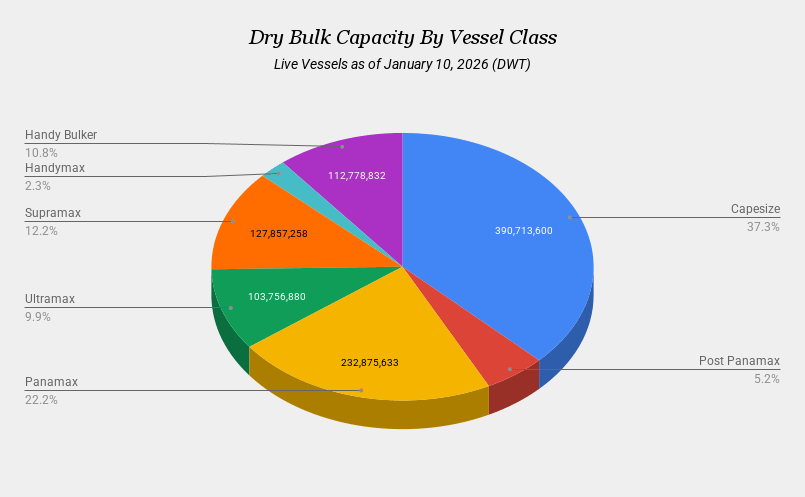
Capesize vessels (with Newcastlemaxes and VLOCs included in this heading) make up approximately 37.3% of total dry bulk fleet capacity.
Dry Bulk Capacity By Vessel Class (VIE)
Source: Value Investor’s Edge
Market developments in the Capesize class can often create ripple effects throughout the dry bulk market or serve as an indicator for other vessel classes. For example, iron ore is imported into China (the world’s leading steel producer) on Capesize vessels, but the steel produced from iron ore is exported out on midsize vessels like Supramaxes, which see Chinese steel exports drive over 57% of all Supramax demand from the country.
Bauxite imports represent an identical parallel, with cargoes brought into China on Capesize vessels and aluminum being exported on midsize and small bulkers. Of course, these raw material import trends can also serve as an indicator for finished products that are exported on containerships or, for vehicles, car carriers.
Recent developments in the Capesize class with regard to China’s industrial production, trade flow shifts associated with greater cargo mile demand, and ongoing low fleet growth have put this particular class in focus for 2026.
Demand
Several years ago, China grabbed headlines when it announced that it would be transitioning over to a consumer-driven economy, much like the models in the US and Europe. But the timing for that transition proved inauspicious, as economic turmoil, a housing market collapse, and negative wealth effects gripped the nation, thereby curbing consumer appetites and stalling that transition.
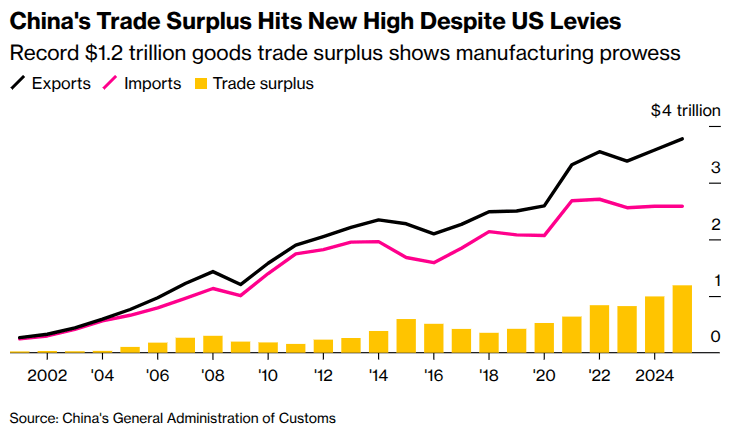
However, a recent bright spot has emerged in the form of growing global demand for their products, which has led to a strengthening ratio of trade to GDP in 2025.
China’s Trade Surplus (Bloomberg)
Source: Bloomberg
This data point hasn’t been lost on China’s leadership, where its latest five-year economic plan doubled down on its production-led development model, elevating a “modernized industrial system” to the #1 priority, up from #2 in the previous plan.
This renewed focus on industrial productivity bodes well for growing seaborne imports and exports, particularly in regard to the dry bulk segment.
A shift back to the traditional model (with an emphasis on advanced manufacturing, electric vehicles, and automation) comes at a serendipitous time since China’s exports grew surprisingly well in 2025, despite trade tensions with the United States. While exports to the United States declined significantly due to high tariffs, this loss was more than offset by sharp increases in exports to other regions, including the European Union, Southeast Asia, Latin America, and Africa.
The result was China posting a record-breaking trade surplus that exceeded $1 trillion for the first time. Additionally, China’s strong export performance was aided by cost advantages in its manufacturing sector (a depreciation of the real exchange rate, consistent with domestic deflationary pressure), which allowed China to offer lower export prices.
These trends are poised to continue in 2026, and both steel and aluminum, derived from iron ore and bauxite, which are transported primarily by Capesize vessels, are key components for many of China’s export products.
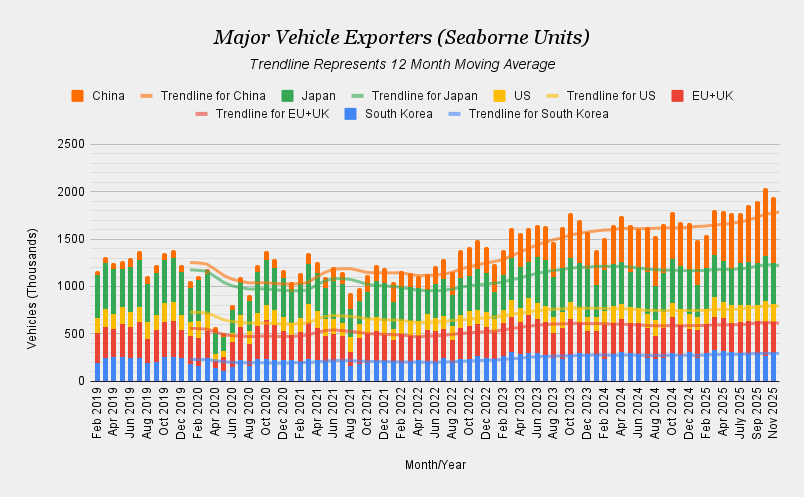
One Chinese export in particular is gaining momentum: Vehicles.
While other top vehicle-exporting nations have experienced stagnant growth, China has seen seaborne vehicle exports growing at a significant pace.
Major Vehicle Exporters (VIE)
Source: Value Investor’s Edge
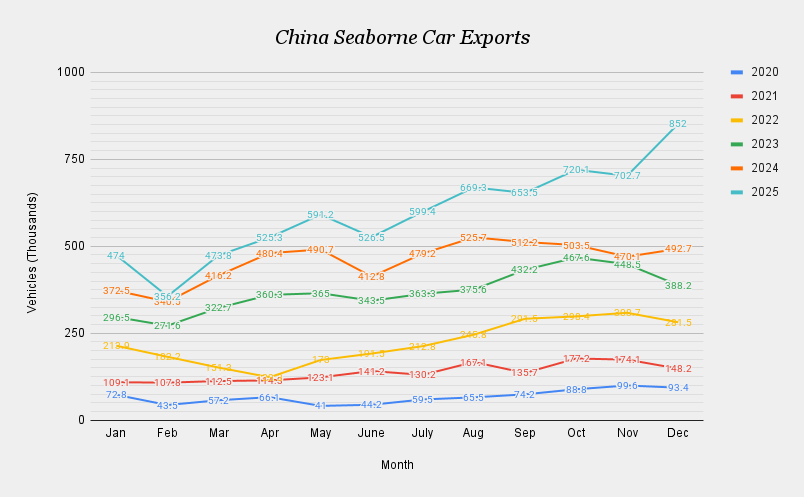
In fact, the latest figures available show December of 2025 witnessed a 73% increase in seaborne vehicle exports compared to December 2024.
China Seaborne Car Exports (VIE)
Source: Value Investor’s Edge
The evolution of affordable BEVs has been a driving force in these gains. Key materials in BEV production include lithium, cobalt, nickel, manganese, and graphite for batteries, along with copper, steel, and aluminum for the drivetrain, and rare earth elements such as neodymium, dysprosium, and praseodymium for permanent magnets in motors. Demand for these commodities is fostering greater dry bulk vessel employment.
Additionally, Chinese brands are expanding dealership networks across the globe faster than others while collaborating with local banks to extend credit lines to some buyers who had previously been shut out of the market, leading to new avenues of growth.
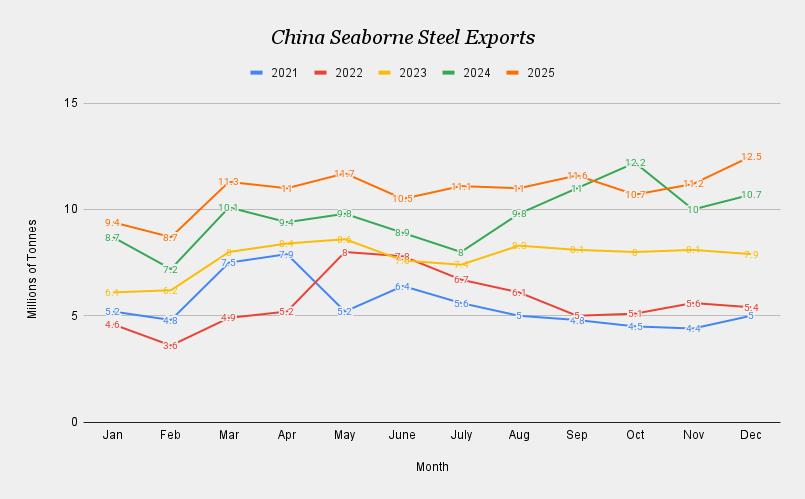
Traditional Chinese exports, such as raw steel, have also been doing extremely well as of late, with 2025 posting a new annual seaborne export record while December set a new all-time high for a single month.
China Seaborne Steel Exports (VIE)
Source: Value Investor’s Edge
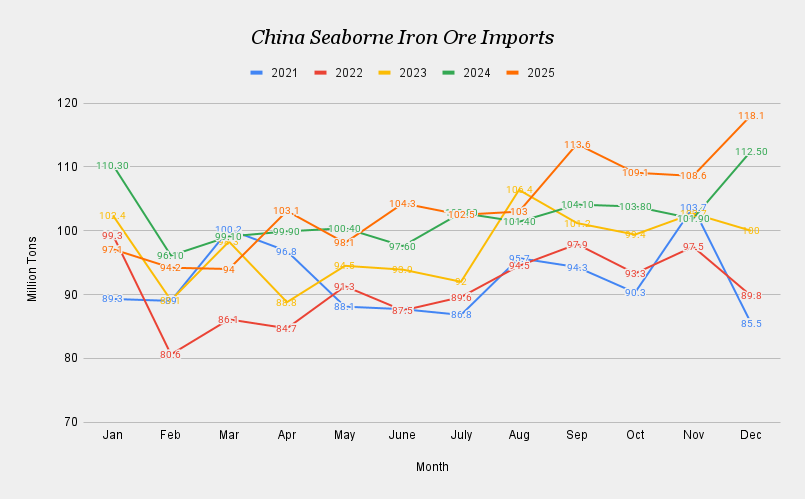
China is heavily dependent on iron ore imports to produce this steel, which is why it should come as no surprise that these record steel exports first required record iron ore imports.
China Seaborne Iron Ore Imports (VIE)
Source: Value Investor’s Edge
Steel exports for the whole year rose by 7.5% from the year before, while low in-plant inventories and improved steel margins also encouraged mills to book more cargoes.
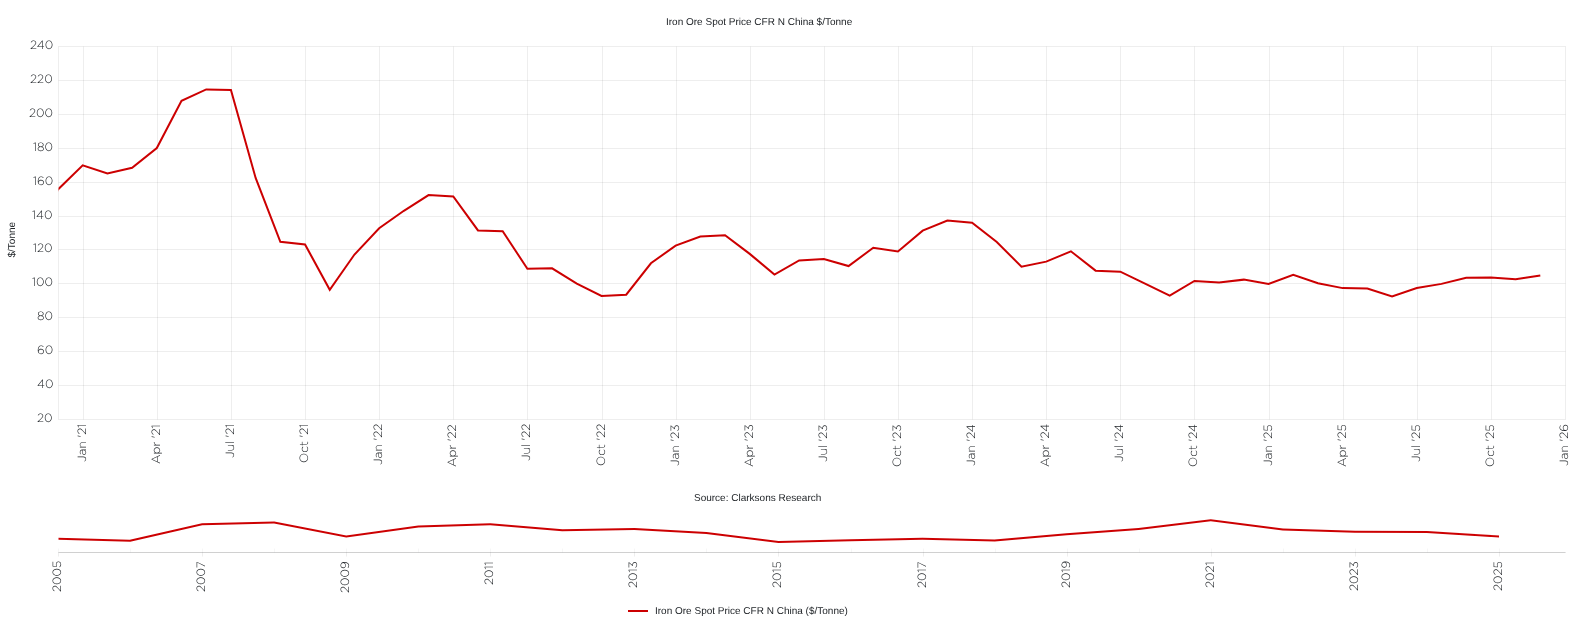
These steel margin improvements can be attributed to a Government-orchestrated effort to curb the least economical steel mills while iron ore prices stabilized at the lowest level in many years.
Iron Ore Spot Price China (Clarksons Research)
Source: Clarksons Shipping Intel
Going forward, iron ore prices are expected to remain favorable for steel mills with the Simandou iron ore project in Guinea now online.
Simandou
The first iron ore shipment to China from Simandou occurred in December 2025. Simandou is projected to supply up to 120 million tonnes annually by 2030, representing a 4.8% increase to a market that is already well supplied – keeping iron ore prices low.
But another benefit of the Simandou iron ore mine with regard to shipping is that China has invested heavily in this project and is expected to draw strongly on that supply. The Guinea to China shipping lane is one of the longest possible routes. Therefore, any cargo transported between these two nations results in an outsized gain in cargo mile demand.
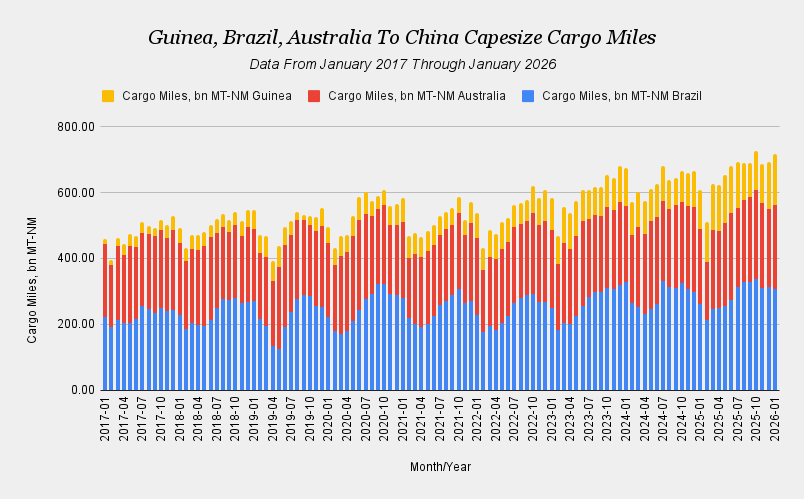
Already, Bauxite exports out of Guinea, with most going to China, have had a significant impact on Capesize demand, making it the third most important route.
Top Three Capesize Cargo Mile Demand (VIE)
Source: Value Investor’s Edge
The addition of Simandou’s iron ore output being added to Guinea’s cargo mile demand totals suggests that by 2030 it could become the second greatest contributor to Capesize cargo mile demand, surpassing Australia and only slightly behind Brazil.
Bauxite will continue to contribute to cargo mile demand as well. China has witnessed a sixteen-fold expansion of aluminium output since 2000 and in 2025 absorbed 88% of all bauxite cargoes shipped by sea last year, while Guinea accounted for about 73% of global bauxite exports. Bauxite volumes exported out of Guinea grew by 25% in 2025 alone. This rapid growth in bauxite demand combined with the China/Guinea trade dynamic ensures further cargo mile demand gains attributed to the bauxite trade through 2030, which will continue to support Capesize vessel utilization.
As of February 11, YTD Capesize cargo mile demand is already up 3.33% compared to this same period in 2024. But, as Simandou’s output increases in 2026, this figure is certain to rise.
Supply
While 3.33% cargo mile demand growth doesn’t sound impressive on its own, from a market perspective, it should be compared against expected net capacity growth for the Capesize fleet. Like any market, if demand outpaces supply, prices (which in this case are represented by spot/time charter rates) will rise.
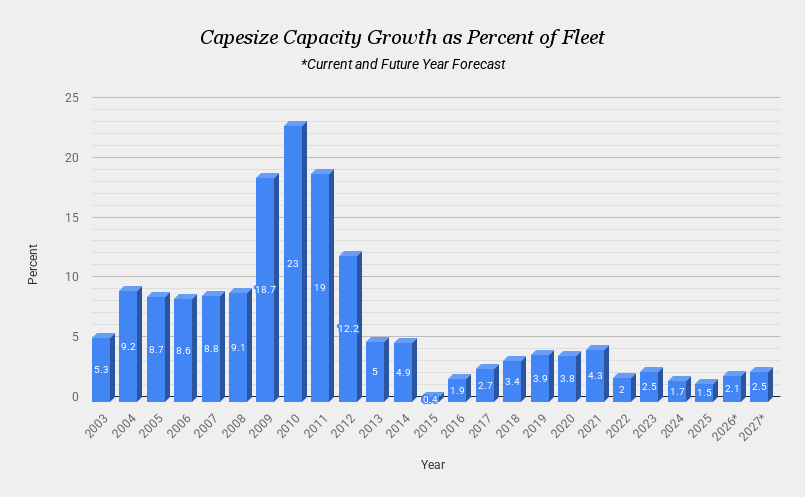
In 2026, market tightening is indeed anticipated with projected net capacity gains of just 2.1% for the Capesize fleet, marking the fifth straight year of below-average fleet expansion.
Capesize Net Capacity Fleet Growth (VIE)
Source: Value Investor’s Edge
If these 2026 supply/demand projections come to fruition, it will result in demand outpacing supply in four out of the last five years.
Here is where the expected divergence between supply and demand becomes interesting: A given degree of market tightening will have a lesser impact on a market experiencing significant disequilibrium – where low rates are being observed. However, as that market nears equilibrium or crosses over to disequilibrium where rates are strong, that same degree of market tightening will have a more profound impact. This tighter market is where we find ourselves in the current cycle, evidenced by the Baltic Dry Index and Baltic Capesize Index rates presented in the beginning of this report. Therefore, the seemingly slight degree of market tightening anticipated in 2026 will likely have an outsized impact relative to similar degrees in past years.
While demand-side projections through 2030 appear favorable, a complementary supply-side forecast would be needed to maintain desirable market conditions.
Fortunately, that supply-side forecast appears cooperative. Though Capesize newbuild contracts were the greatest in over a decade in 2025, the order book remains at an acceptable level of 12.34%. New-build contracting has slowed, and the deals that have been inked in 2026 show delivery dates of 2028 and 2029, suggesting 2026, and most likely 2027, are etched in stone.
That 12.34% Capesize Orderbook should be balanced against the rapidly aging fleet, where 9.96% are 20 years old and beyond.
Capesize Age Fleet Profile (VIE)
Source: Value Investor’s Edge
But the headline event in the chart above is the significant number of deliveries that occurred between 2009-2012, which are nearing the end of their service life.
This aging fleet is especially relevant for a good reason: On Value Investor’s Edge, in 2025, I published a study on vessel utilization as ships age. The following is an excerpt from the examination of Capesize vessels.
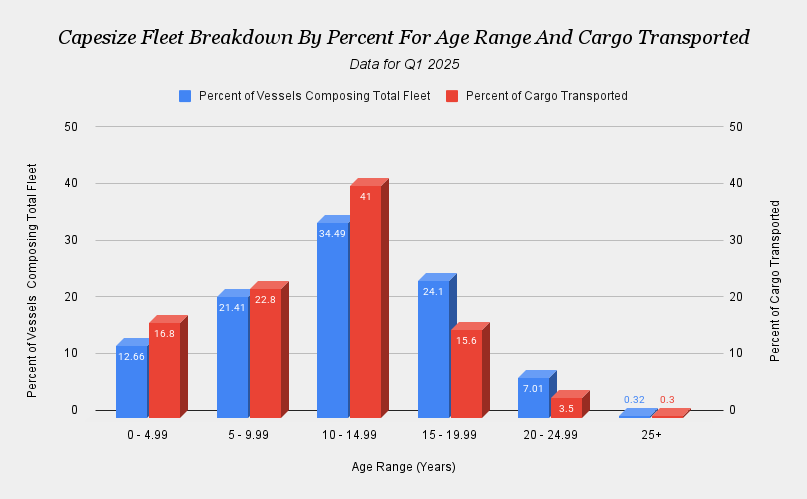
For the capesize class, approximately 64.69% of the fleet is under the age of 15 in terms of vessel numbers and 71.24% in terms of DWT, but those vessels are responsible for transporting 80.6% of all cargo loaded onto capesize vessels.
Capesize Fleet Breakdown By Percent For Age Range And Cargo Transported (VIE)
Source: Data VesselsValue – Chart by Value Investor’s Edge
Notice, that at the 15-year-old mark a shift occurs where these aging vessels transport a smaller percentage of cargoes compared to their composition of fleet capacity.
To summarize, as vessels age, they become less desirable to charterers due to economic efficiency, higher insurance costs for cargoes, port restrictions, or other factors. Additionally, charterers for long-haul voyages typically prefer economically efficient tonnage since fuel costs are lower and time on the water is reduced due to faster sailing speeds. Furthermore, this reduced time for transport also factors into savings when it comes to cargo financing for the voyage. Therefore, with that large swath of deliveries between 2009-2012 now hitting this less desirable age range, the “desirable” fleet is actually shrinking in size, which will likely work to buoy rates for these modern vessels.
As modern vessels enjoy higher rates due to the tight supply of tonnage, older vessels can also benefit as charterers then turn to them as a secondary preference, thereby pushing up rates for that age range, which closely track the ups and downs of their modern counterparts – albeit at slightly lower levels.
Higher rates are not the only benefit to this market. While FCF is a very important metric in company valuations, another key metric is NAV, which is determined by prices for vessels.
During bull markets, vessel prices increase in direct correlation with rates and future expectations of those rates. For bear markets, the opposite trend is observed.
That forward-looking component in asset prices is an important indicator regarding the market outlook. If owners see trouble ahead, they typically back off secondhand purchases, especially for older vessels, since their remaining years are closely tied to near-term market conditions.
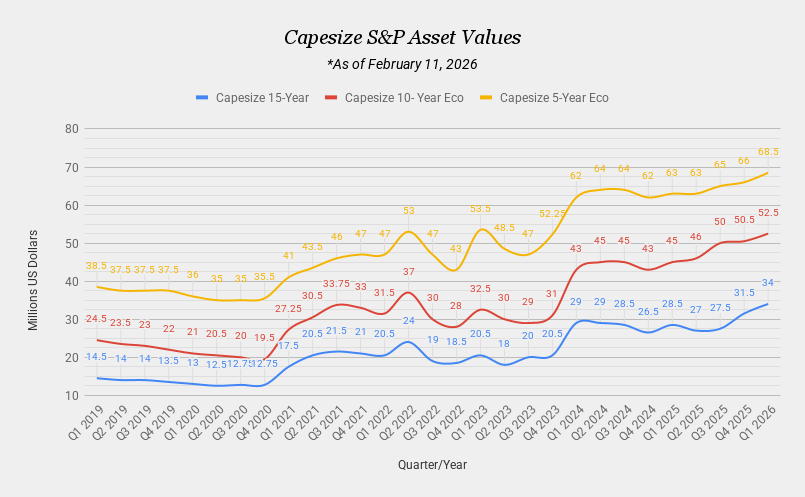
Therefore, the fact that Capesize asset values continue to climb upward with strong momentum for new and vintage vessels alike indicates that owners continue to bid up tonnage on the S&P (Sales & Purchase) market.
Capesize Asset Values (VIE)
Source: Value Investor’s Edge
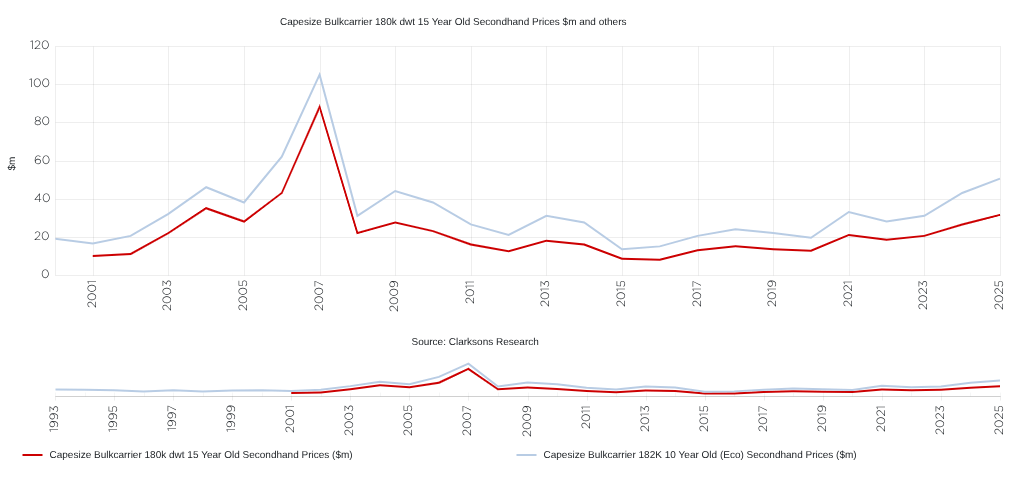
In fact, these current prices are among the highest in history, second only to the Chinese commodity boom era.
Capesize Asset Values Long Term (Clarksons Research)
Source: Clarksons Shipping Intel
One more important consideration is that during these bull runs, owners want as much tonnage on the water, which means they often forego newbuild orders and spend their limited capital on secondhand vessels that are already in service, allowing them to more fully capitalize on this window of opportunity. This also works to keep newbuild orders under control.
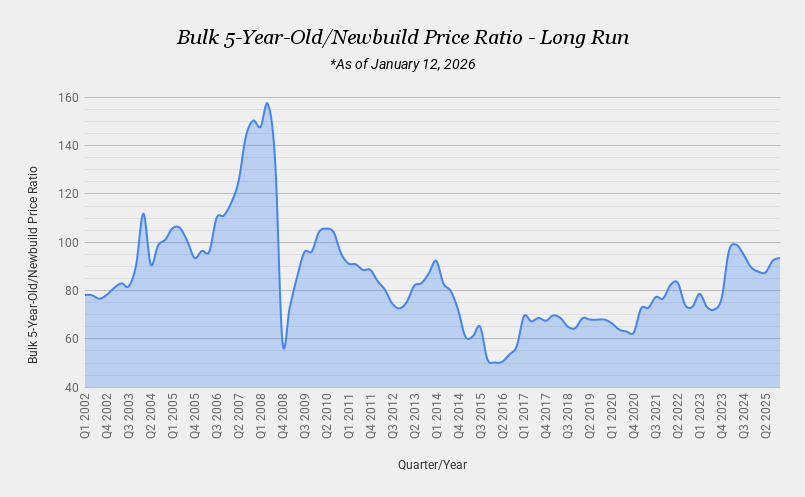
In strong bull markets, secondhand asset prices can often command a higher price than what a newbuild would be. This situation is currently unfolding in the market, indicating strong resolve on the part of owners.
Capesize 5-year-old/Newbuild Price Ratio (VIE)
Source: Value Investor’s Edge
If market conditions unfold as expected through 2030, both rising spot/TC rates and increasing secondhand prices will continue to play a starring role in rising company valuations.
Conclusion
The Capesize market is off to a fantastic start to 2026, exhibiting counter-seasonal strength, which typically signals a favorable structural shift. This often indicates a strong outlook for the remainder of the year, putting The Baltic Dry Index and Baltic Capesize Index on track to post their best readings in 15 years.
Developments in China play a key role in Capesize fortunes since they are a primary importer of both iron ore and bauxite, which is used for making steel and aluminum.
China’s shift back to focusing on industrial production over consumption comes at a fortuitous time, amid record-breaking trade surplus that exceeded $1 trillion for the first time, cost advantages in its manufacturing sector (a depreciation of the real exchange rate, consistent with domestic deflationary pressure), strong steel exports with improving margins, and increasing vehicle exports, which are benefiting from new avenues of growth.
Because Guinea to China represents one of the longest hauls in shipping, Guinea has played a major part in cargo mile demand growth with its bauxite exports to China over the past years. The start of exports from Guinea’s Simandou iron ore project will continue to foster ongoing cargo mile demand gains while keeping iron ore prices low. China owns a significant portion of the Simandou project, which indicates uptake of cargoes to China will be strong.
As of February 11, YTD Capesize cargo mile demand is already up 3.33% compared to this same period in 2024. The first iron ore shipment to China from Simandou occurred in December 2025, and as output increases in 2026, that 3.33% cargo mile demand figure is certain to rise.
The Capesize fleet is expected to grow by 2.1%, indicating that demand is already outpacing fleet growth, and if that trend holds, it will be four out of the last five years when the market has tightened.
With a tight market already being observed, evidenced by the BDI and BCI, any further tightening in 2026 will likely have an outsized impact relative to similar degrees in past years.
A significant number of deliveries, which occurred between 2009-2012, are nearing the end of their service life. As vessels age beyond the 15-year-old mark, they become less desirable to charterers, resulting in lower utilization. With this large swath of deliveries between 2009-2012 now hitting this less desirable age range, the “desirable” fleet is actually shrinking in size, which will likely work to buoy rates for these modern vessels.
NAV is a key metric by which shipping companies are valued and is determined by prices for vessels. Capesize asset values continue to climb upward with strong momentum for new and vintage vessels alike, indicating that owners continue to bid up tonnage on the S&P (Sales & Purchase) market.
During bull markets, owners want as much tonnage on the water as possible, which means they often forego newbuild orders and spend their limited capital on secondhand vessels that are already in service, allowing them to more fully capitalize on this window of opportunity. In situations like this, secondhand asset prices can often command a higher price than what a newbuild would be.
If market conditions unfold as expected through 2030, both rising spot/TC rates and increasing secondhand prices will continue to play a starring role in rising company valuations.